Magic Eden Temporarily Halts Bitcoin BRC-20 Trading
Magic Eden, a popular NFT marketplace on the Solana blockchain have decided to temporarily halt trading of Bitcoin BRC-20 assets on their platform
 Aaron
Aaron

Author: Animoca Brands Research; Compiler: Felix, PANews
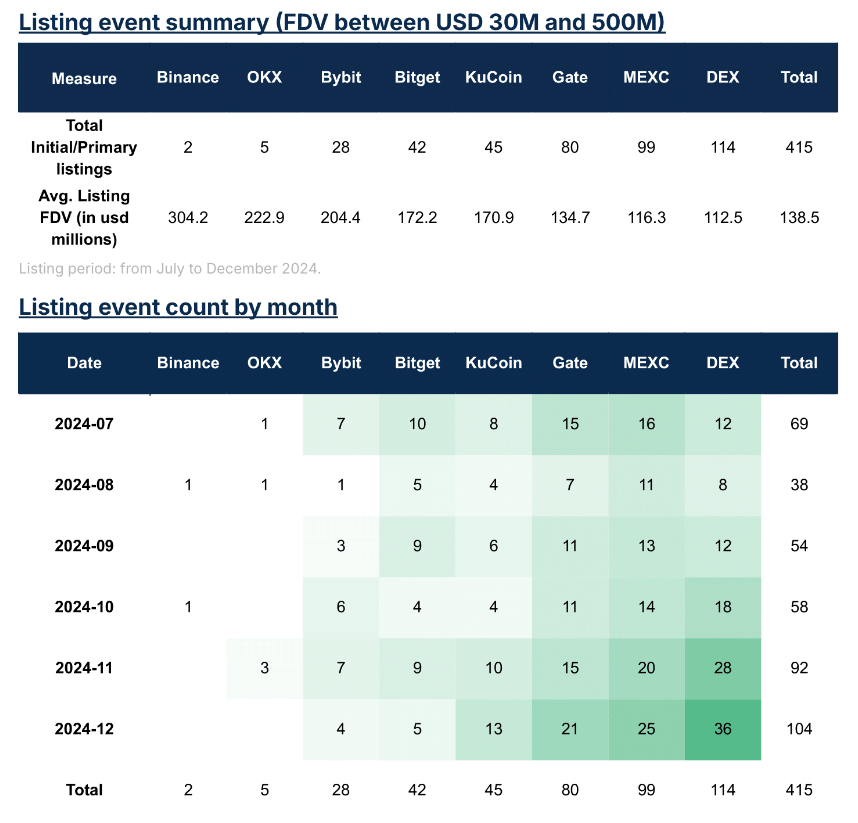
This report analyzes more than 3,000 spot token listing events across 9 major centralized exchanges (CEX) and more than 120 decentralized exchanges (DEX) in 2024. The goal is to assess the overall trend of token listings on each platform and evaluate the price and trading volume performance of tokens during these events.
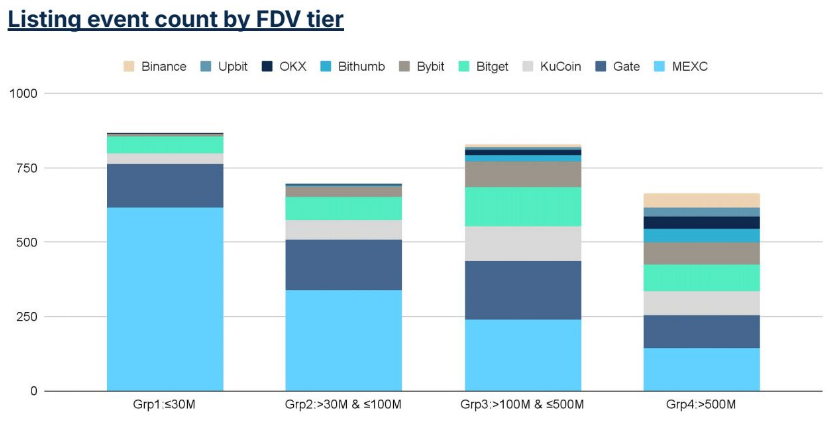
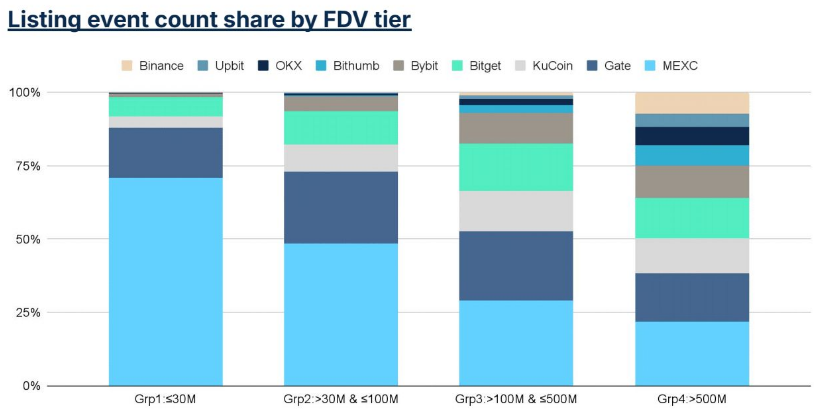
Centralized exchanges use different strategies to determine listing priorities, focusing on different fully diluted valuation (FDV) levels. Exchanges with fewer listed tokens tend to prioritize listing tokens with larger FDVs (over $500 million), while exchanges with more frequent listings tend to prioritize tokens with FDVs below $30 million.
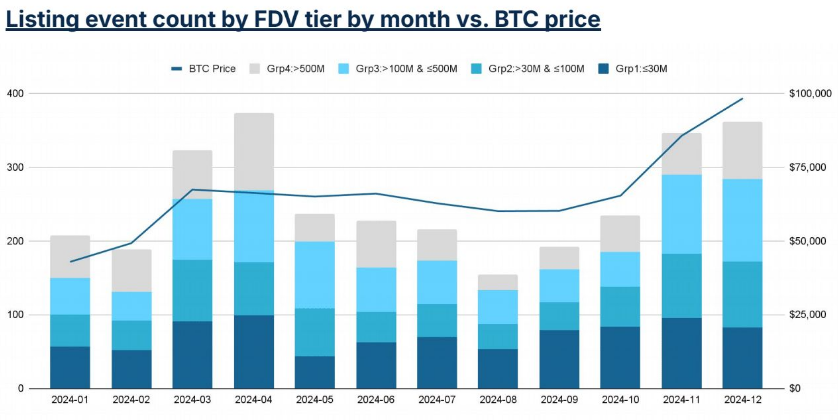
Listing activity is closely correlated with Bitcoin’s price action, with activity increasing during bull runs and decreasing when Bitcoin’s gains stall. While all FDV-sized tokens are affected by this trend, large FDV tokens have a higher sensitivity to changes in market sentiment.
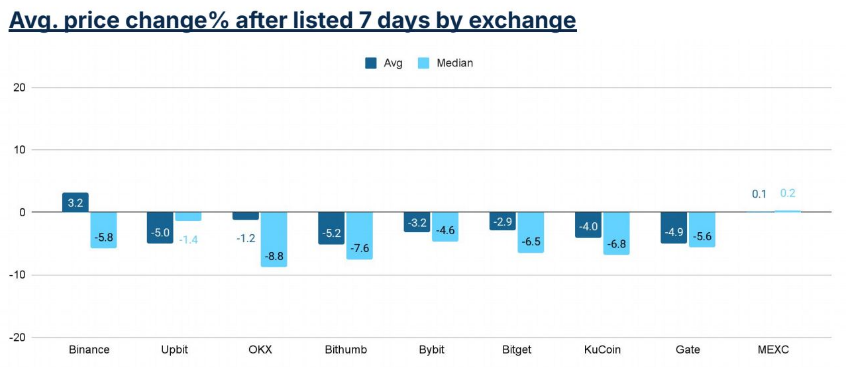
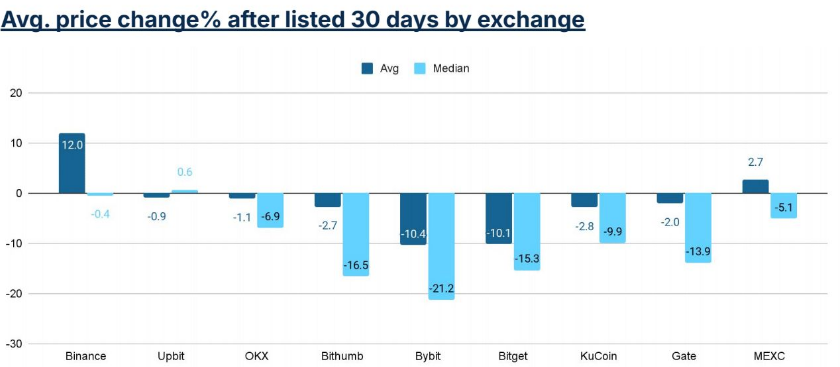
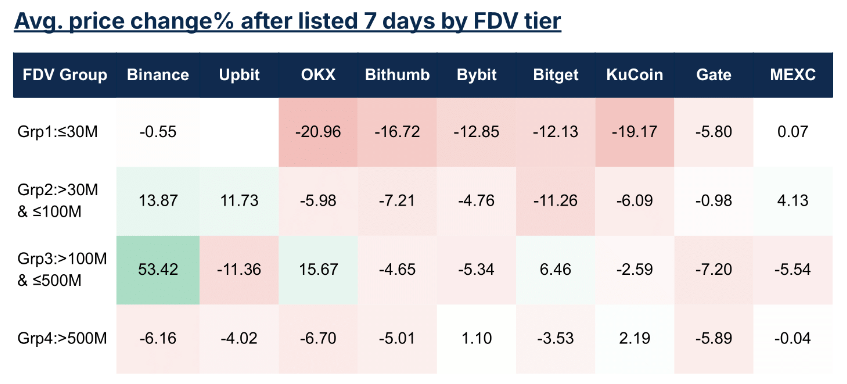
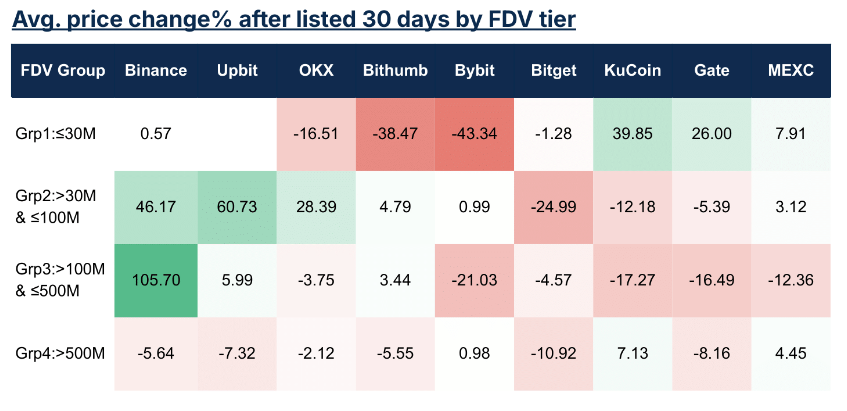
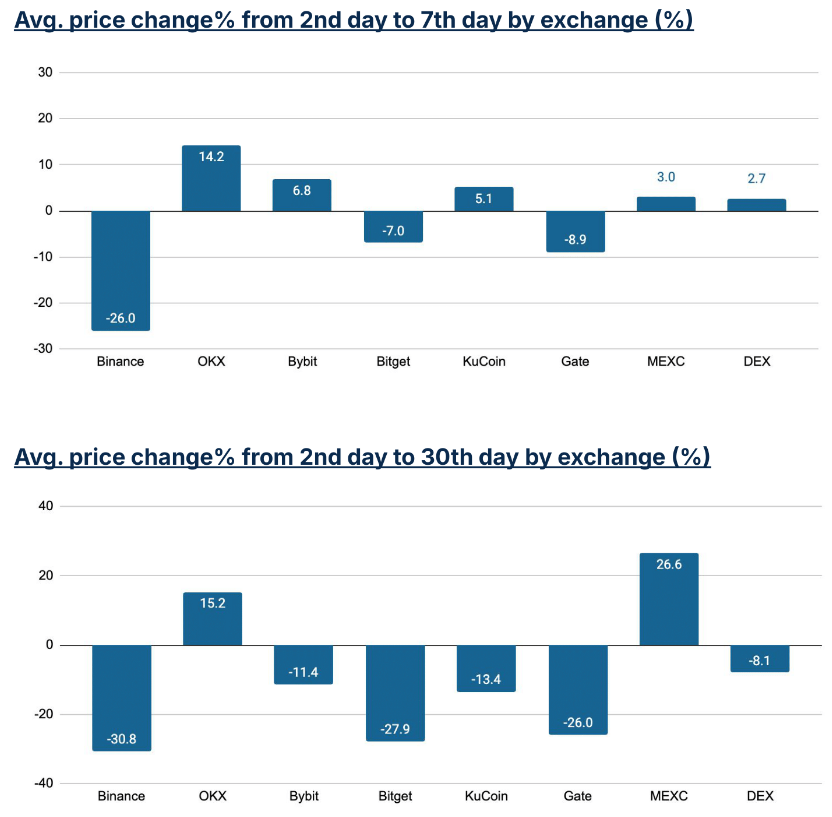
Price performance, measured as 7-day and 30-day changes relative to the closing price on the listing day, largely reflects Bitcoin’s price trends, but does vary between exchanges. A “smiling curve” pattern emerges: exchanges with the highest (e.g., Binance) and lowest (e.g., MEXC) average listing FDV record positive price changes, while mid-sized exchanges (e.g., Bybit, Bitget) experience the largest declines.
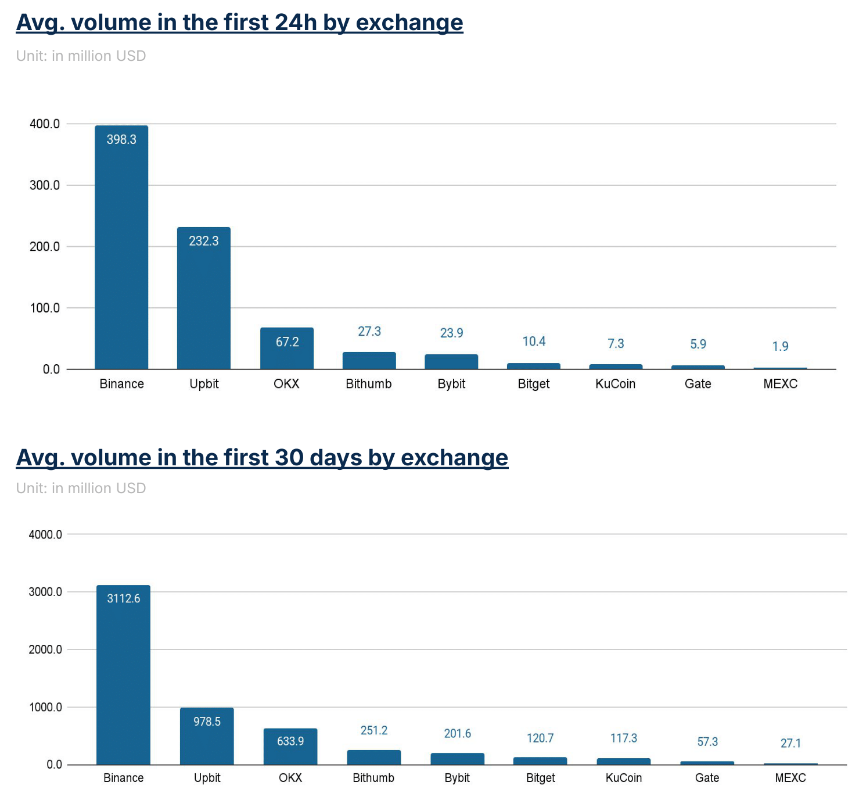
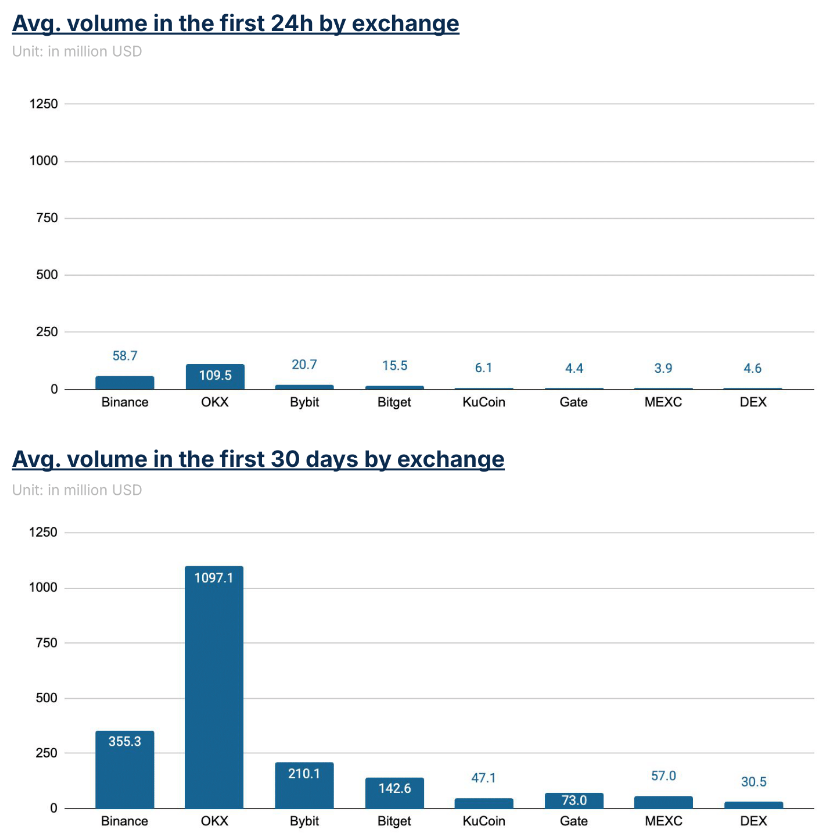
In terms of trading volume, Binance leads in terms of trading volume of newly listed tokens, followed by OKX and Upbit. Notably, Upbit’s first 24h volume is comparable to Binance’s, while OKX leads in volume for tokens in the $30m-$100m FDV class.
Tokens that debuted on DEXs with over $30m FDV performed comparable to debuts on mid-sized CEXs. Price performance of tokens debuting on DEXs (measured by change from day 2 to day 7 and day 30) outperformed 4 of the 5 mid-sized CEXs. Volumes in the first 30 days were also similar or higher than CEXs like Kucoin, Gate, and MEXC.
It is not uncommon for DEX-first tokens to later appear on mid-sized CEXs, but it is uncommon for them to appear on large CEXs. Of the DEX ICOs sampled in the second half of 2024, about 16% of them were subsequently listed on CEX, and only 2% were successfully listed on large exchanges such as Binance, OKX or Upbit.
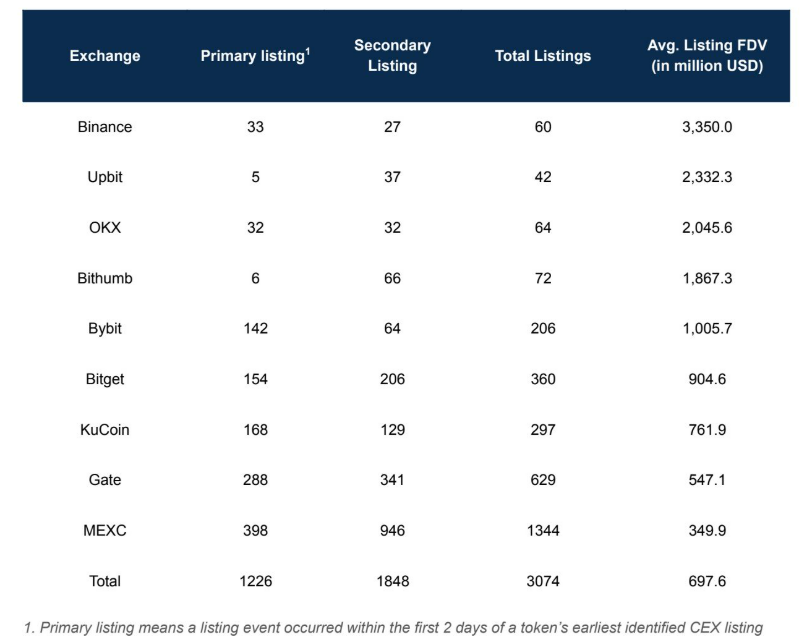
The report records a total of 3,074 token listing events. 1226 events (40%) were identified as primary listings, which were listed within the first 2 days after the token was released; while 1848 events (60%) were identified as secondary listings.
Most exchanges took a balanced approach, participating in almost equal proportions of primary listings and secondary listings.
In general, exchanges that list high FDV projects focus on fewer, larger listings, while exchanges that list smaller FDV projects have more listings.
Two Korean exchanges, Upbit and Bithumb, focus primarily on secondary listings, and due to the practices of these exchanges, the first listing may not be the first listing. In the rest of this article, exchanges will be sorted by their average listing FDV, with exchanges with high listing FDV referred to as "large exchanges" and the rest as "medium exchanges".
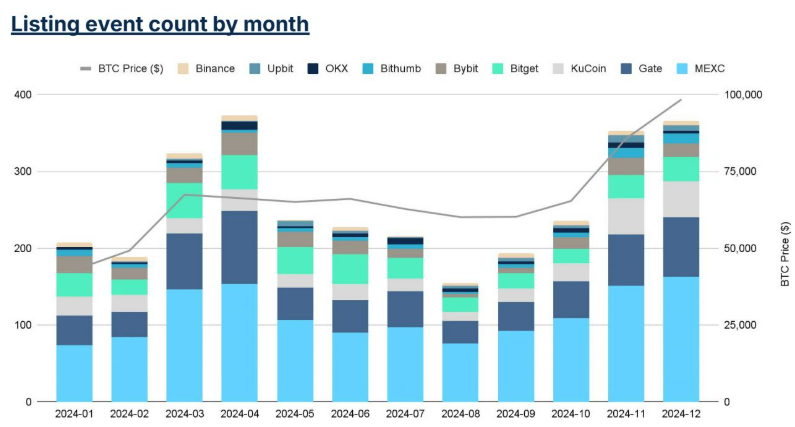
There were more listing events during the bull market (February to March and August to December), while the number of listing events decreased during the market downturn.
April was a standout month, as listing events continued to rise despite the reversal of BTC prices. This effect was not obvious in December, when BTC stagnated again after two months of gains.
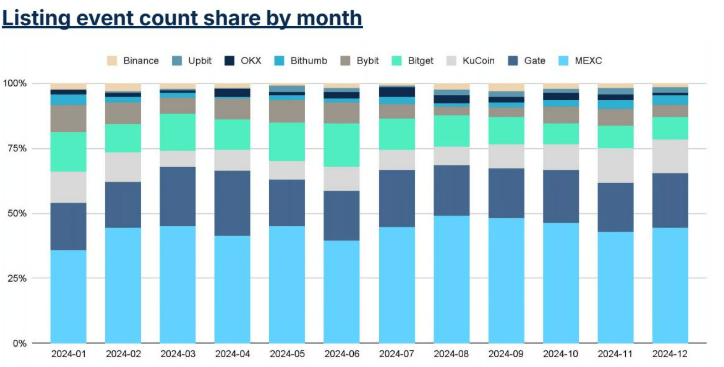
In terms of the number of listings, top exchanges were less affected by the bear market, which is reflected in the increasing share of listings during these periods.
Nevertheless, mid-sized exchanges contribute the majority of listings in the $500M+ category, likely because projects from large exchanges often co-list on mid-sized exchanges, but not vice versa.
Mid-sized exchanges such as Bybit, KuCoin, Bitget, and Gate list more evenly across the four FDV tiers, with a slightly larger share of $30M-$500M. MEXC takes a different approach, focusing on tokens with FDV ≤ $30M, accounting for 70% of listings in this category.
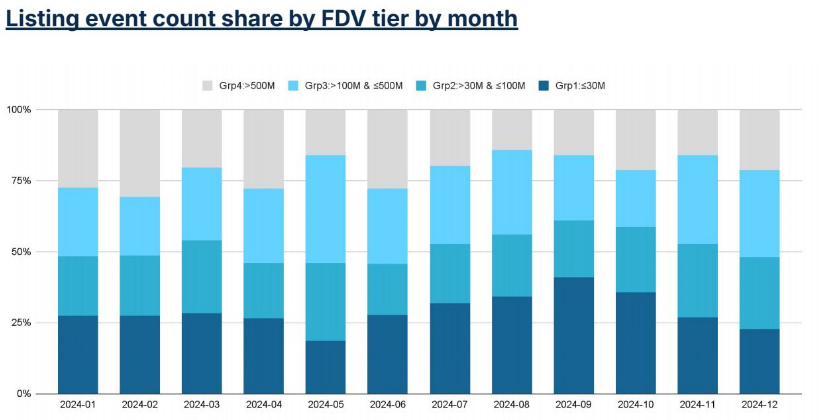
The ≤$30M FDV tier closely tracked overall listing momentum during the bull run, but accounted for a larger share of listings in periods such as June-September.
The price performance of each exchange forms a "smile curve", with tokens at both ends of the curve outperforming those in the middle.
The tokens listed on Binance and MEXC at the two ends showed positive price changes after 30 days, while the average price of Bybit and Bitget listings fell by about 10%.
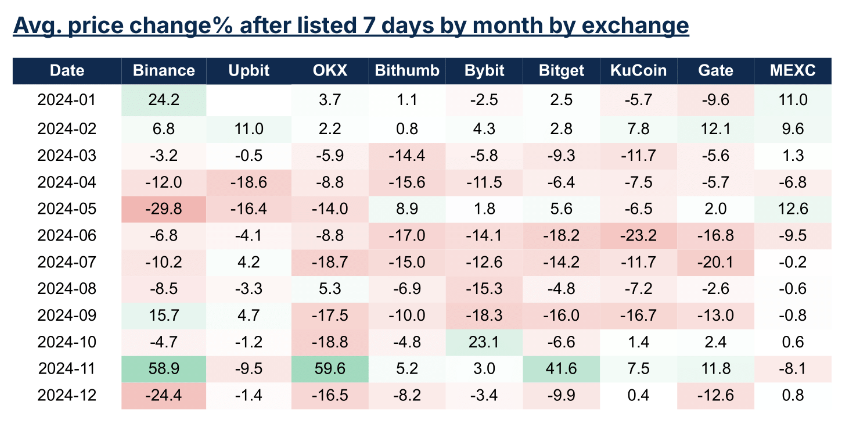
The 7-day price performance showed a similar pattern, with Binance listings rising by about 3%, MEXC listings basically flat, and the middle exchange falling more.
The median price change is generally lower than the average, indicating that a small number of token listing events account for the majority of the share.
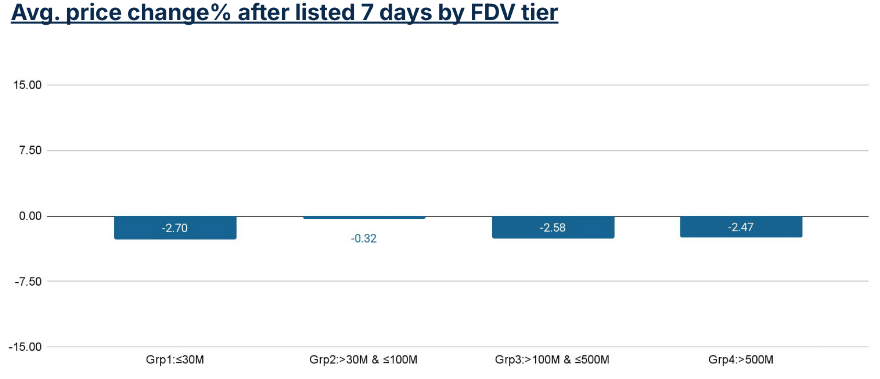
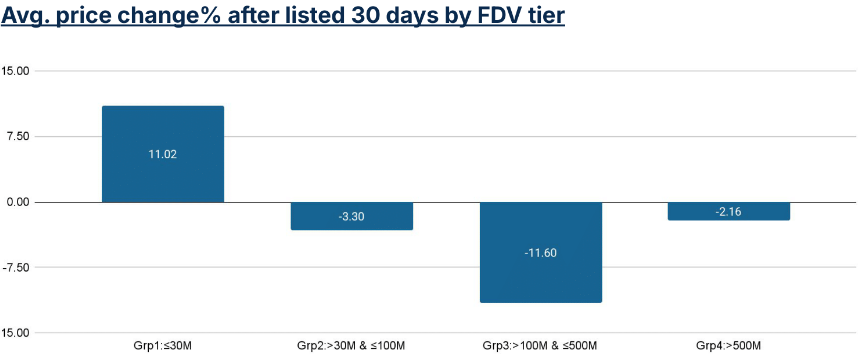
FDV-rated tokens ≤$30m saw a price drop after 7 days, but rebounded strongly by day 30, showing the biggest contrast among the four tiers. FDV-rated tokens in the $30m-$100m and >$500m range saw a modest price drop after 7 days, remaining at similar levels, on average, over the 30-day period.
FDV-rated tokens in the $100m-$500m range saw a 2% drop in the first 7 days, but saw the drop extend to over 11% by day 30, indicating an overall downward trend after the first week.
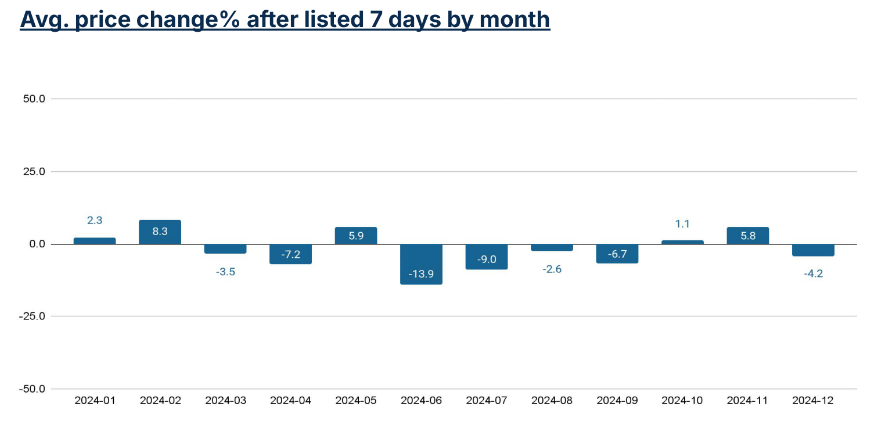
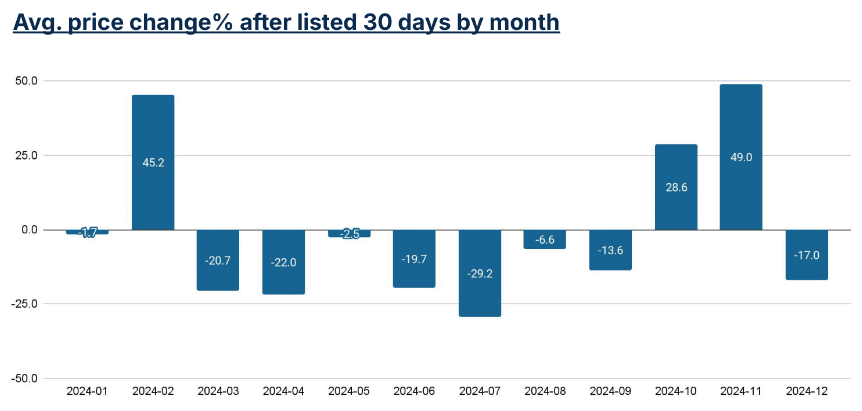
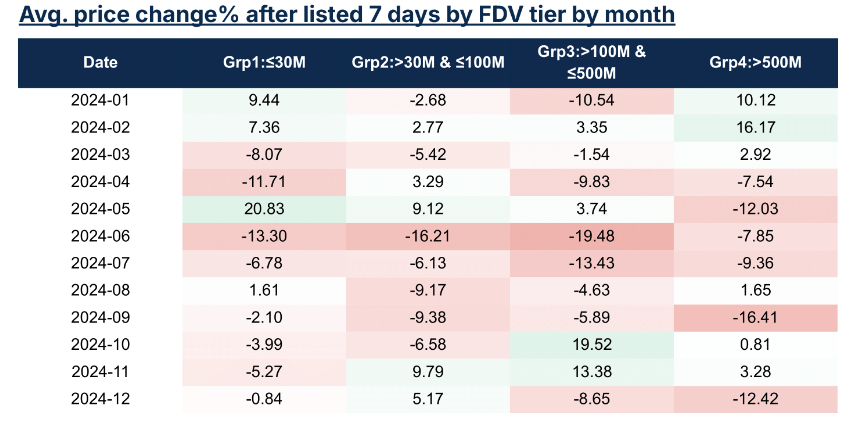
January and May saw deviations from the overall BTC price trend: tokens listed in January underperformed despite BTC’s impending rebound; tokens listed in May performed well despite May’s slow bear market.
Tokens listed in December underperformed despite a neutral market.
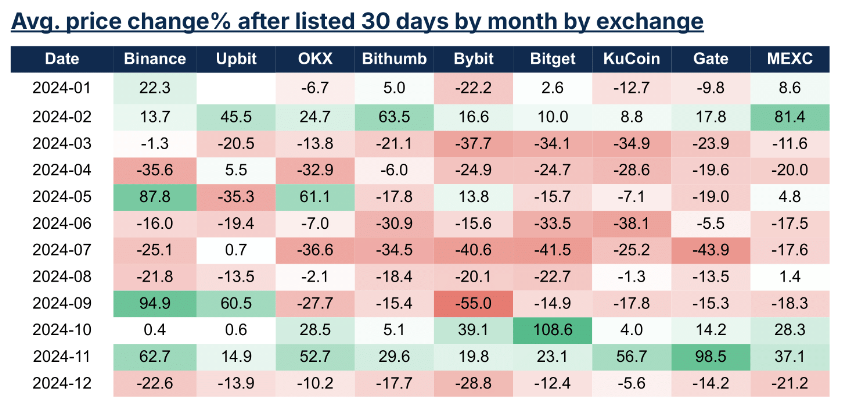
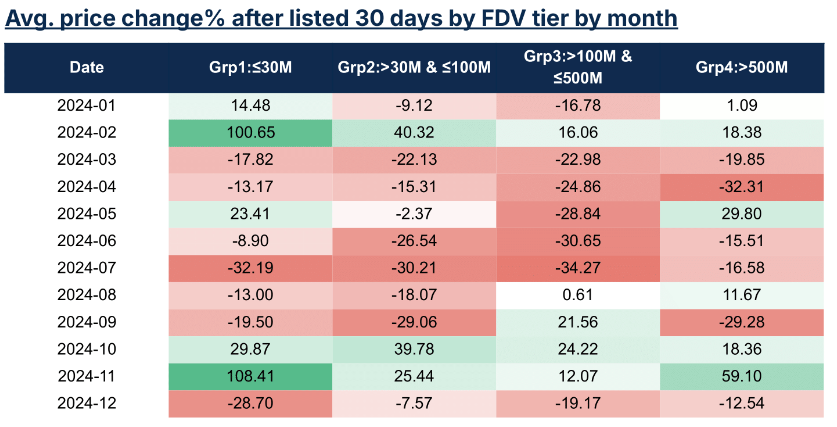
Medium FDV token (30-500M USD) listings performed better on large exchanges than on medium exchanges. Large FDV token (>500M USD) listings performed relatively consistently across exchanges, with minimal price volatility from day 7 to day 30.
Mid-cap FDV tokens experienced strong 7-day price gains in October and November, but still lagged behind other categories at 30-day.
Large FDV tokens have shown stronger consistency across months, with half of the months seeing positive 7-day and 30-day price performance.
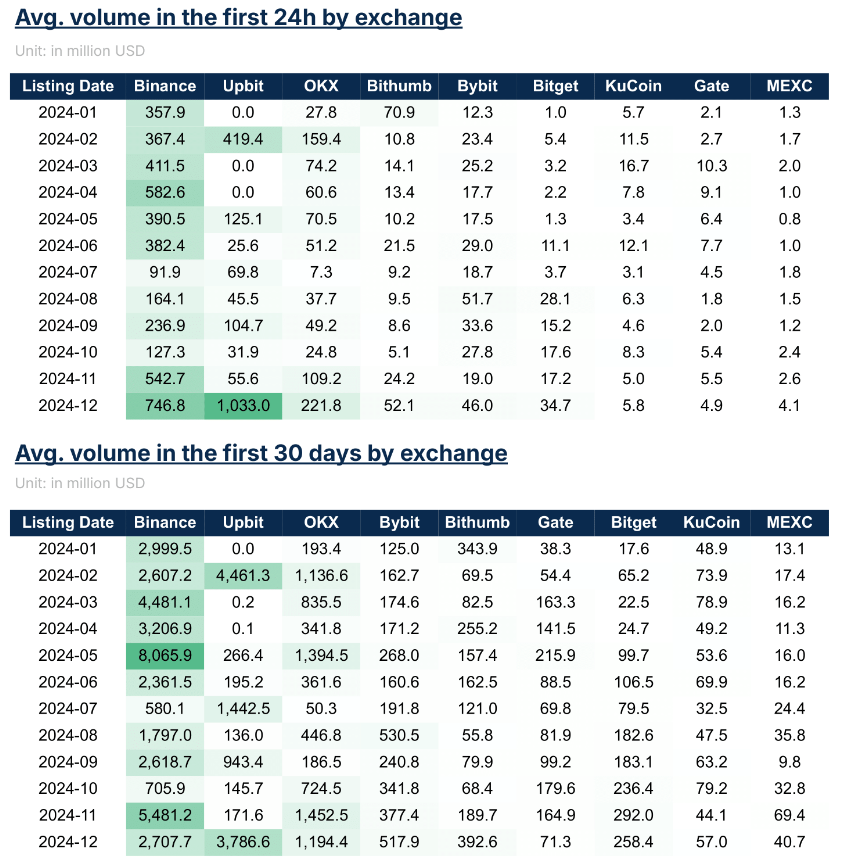
Among mid-sized exchanges, Bybit had strong volume in both the first 24 hours and the full 30 days.
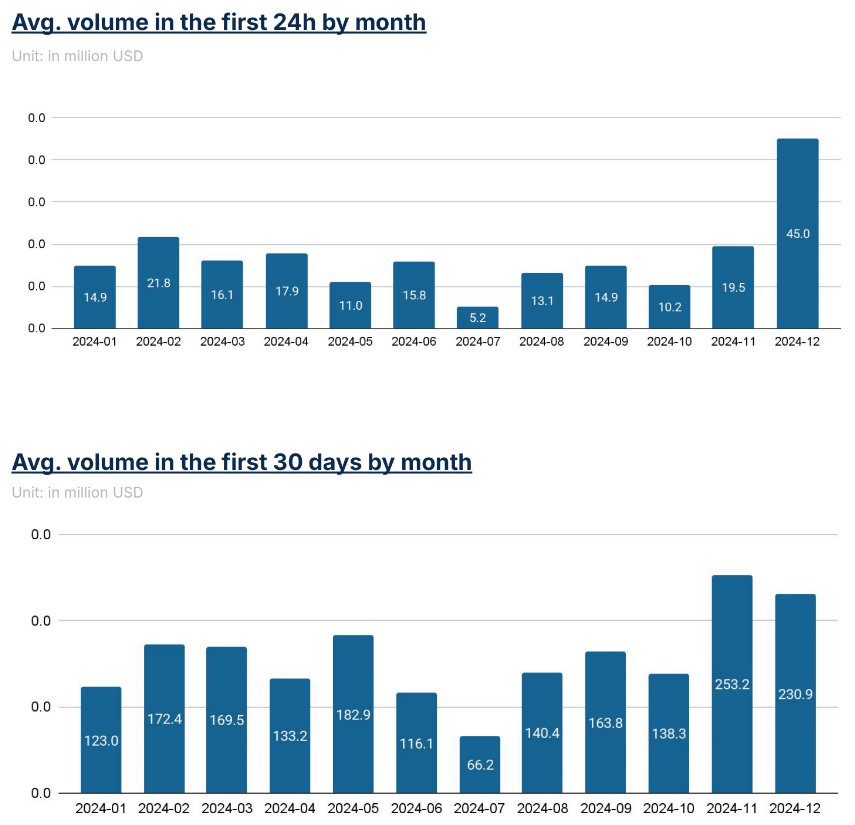
First-time listing trading volume largely follows the bear/bull market cycle, with larger first-time listing trading volumes during February to March and September to December.
In April, a month after the first wave of price increases, listing activity exceeded expectations, but trading volume was below the 30-day average. This suggests that too many listings during quieter market periods may dilute the trading volume of newly listed tokens.
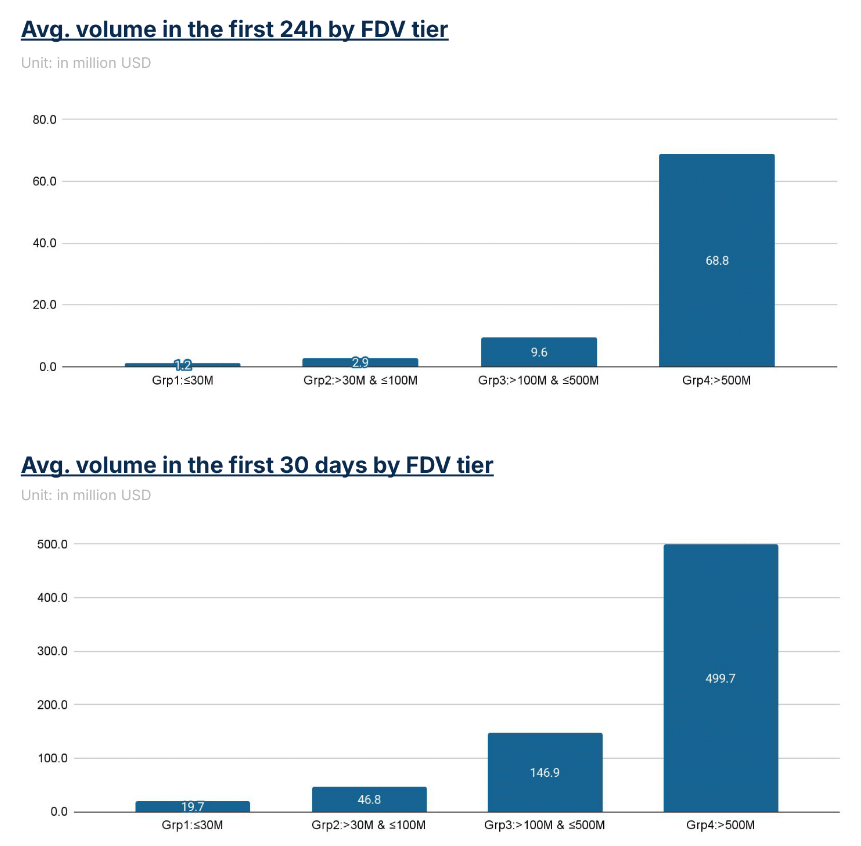
The trading volume basically follows the token FDV level. Compared with the minimum FDV level, the trading volume of the maximum FDV level in the first 24 hours is 60 times that of the minimum FDV level, and the trading volume in the first 30 days is 25 times that of the minimum FDV level.
In most months, Binance leads in the trading volume of newly listed tokens. Upbit's newly listed tokens show high uncertainty in initial trading volume.
While it leads in 30-day trading volume in February, July, and December, there are also months with very low trading volume of newly listed tokens.
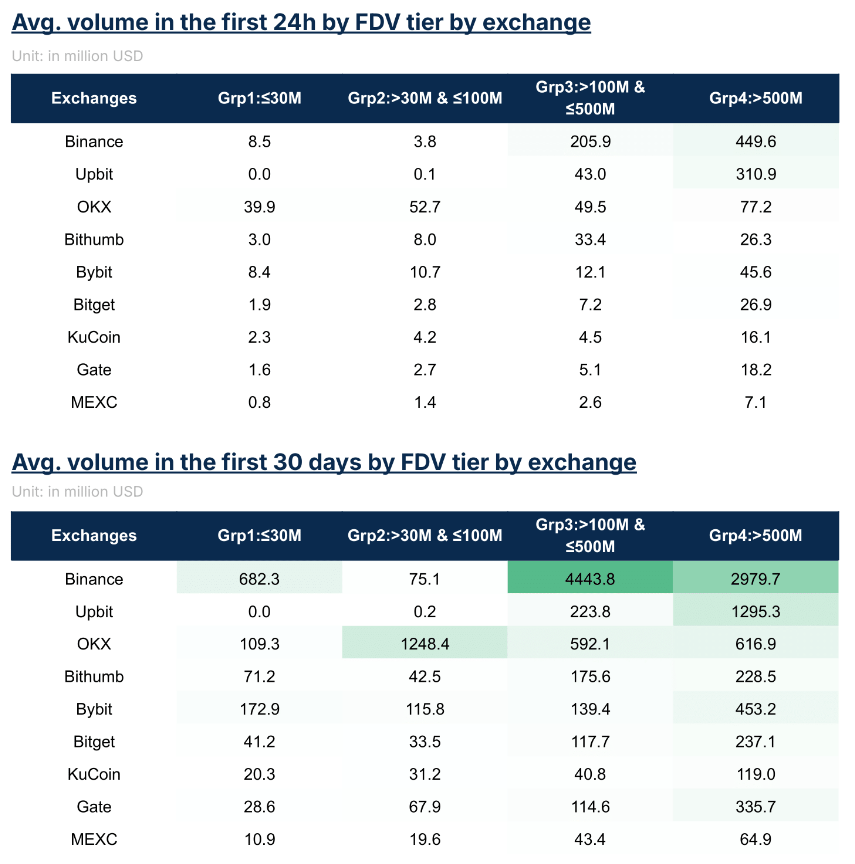
Binance has the largest trading volume, mainly concentrated in the FDV category of 100 million to 500 million US dollars.
On the other hand, OKX has significant trading volume for mid-level FDV tokens ($30 million to $100 million).
Among medium-sized exchanges, Bybit has a relatively stable trading volume in all FDV levels, while other medium-sized exchanges usually have trading volumes concentrated on medium-level FDV tokens.
DEX listings are often seen as a complement to CEX listings. DEX liquidity pools are usually created at the same time as the initial CEX listing, allowing users the flexibility to trade on-chain or through CEX. On the other hand, listing exclusively on a DEX is usually associated with a more decentralized approach and is mainly used by long-tail tokens with limited mainstream appeal.
However, recently an increasing number of projects have chosen a DEX as their sole initial listing platform, delaying or forgoing a CEX listing for a period of time. To assess the feasibility and impact of this strategy, this article analyzes relevant data and metrics to compare DEXs and CEXs.
To ensure an objective comparison, DEX listings are defined as tokens that have maintained liquidity exclusively on a decentralized exchange for at least 30 days. For CEX listings, we focus on first listing events, representing tokens that were introduced to a centralized exchange as their primary trading venue. To avoid biasing the results for long-tail tokens, the analysis was limited to tokens with a FDV between $30 million and $500 million to ensure balance between the two groups of tokens.
When measuring price performance, the percentage price change from day 2 to day 7 and day 2 to day 30 is used instead of the time period from listing to day 7 or day 30. This adjustment takes into account the different price discovery mechanisms between CEX and DEX on the day of listing, otherwise a direct comparison would be invalid. For trading volume, a consistent approach is maintained, using the previous 24 hours and 30 days of trading volume as the key metric.
The analysis sampled 415 major listing events that occurred in the second half of 2024, focusing on tokens with fully diluted valuations (FDV) between $30 million and $500 million. Of these, 114 were classified as priority DEX listings, meaning that the token was listed only on a DEX in the first month.
In August, DEX listings demonstrated a pick-up in activity in Q4 after a slump that was more sensitive to market momentum. In Q3, priority DEX listings accounted for less than 20% of new tokens, but by November and December, this proportion surged to over 30%.
Most CEX listings in this analysis are concentrated on mid-sized exchanges. Binance and OKX, on the other hand, had only a few listings.
Among medium-sized CEXs, the performance from day 2 to day 7 was mixed. By day 30, all listed tokens showed negative price changes except for the tokens on MEXC.
In contrast, tokens listed on DEXs for the first time showed positive growth on day 7 and slightly declined on day 30, outperforming most mid-sized CEX-listed tokens.
OKX led the price performance among large CEXs, with listed tokens rising by about 14% from day 2 to day 7 and maintaining this level after 30 days. However, due to the limited amount of data, the performance of Binance and OKX should be interpreted with caution.
DEX trading volume is comparable to medium-sized CEXs such as KuCoin, Gate, and MEXC, while OKX and Binance have higher average trading volumes than other exchanges.
The concentration of trading volume in the first 24 hours of DEX and CEX shows a similar pattern, indicating that the market is paying attention to the same trend.
This volume performance, combined with price performance 30 days after listing, suggests that the impact of first-time DEX listings on token performance is comparable to that of mid-sized CEXs.
The 415 sampled listing events cover a total of 238 tokens. Among them, 126 tokens were initially listed only on DEXs, while the rest were listed on medium-sized or large centralized exchanges. It is important to note that the DEX-listed tokens included in the analysis are limited to tokens indexed on CoinMarketCap.
Of the tokens that were initially listed on a DEX, about 16% were later listed on a CEX, mostly in the mid-sized CEX category. However, only 2% of tokens that first listed on a DEX subsequently received support on a top CEX, such as Binance, Upbit, or OKX. For tokens that first listed on a mid-sized CEX, about 3% ended up listing on a high FDV CEX, which is comparable to the probability of tokens that first listed on a DEX.
These findings suggest that while priority DEX tokens have a fair chance of being listed on a CEX, they are most likely to land on mid-sized exchanges. Regardless of whether a token starts on a DEX or a mid-sized CEX, the probability of a mid-sized FDV token landing on a top CEX remains low.
Magic Eden, a popular NFT marketplace on the Solana blockchain have decided to temporarily halt trading of Bitcoin BRC-20 assets on their platform
AaronThe brief supports an appeal against the IRS that challenges government access to user transaction history on crypto platforms.
 Alex
AlexThe new circular comes as Hong Kong embraces crypto but struggles with regulation.
 Clement
The Attorney General alleges that these companies engaged in fraudulent activities and attempted to conceal losses amounting to over a billion dollars and lying to over 230,000 investors.
ClementRenowned author Robert Kiyosaki, famous for his book "Rich Dad Poor Dad," has shared his predictions on the future prices of Bitcoin, gold, and silver, alongside a stern warning concerning the risks associated with holding U.S. dollars, which he termed "fake money."
 Jasper
These offerings, christened "Gas Station" and "Smart Contract Platform," promise to usher in an era of enhanced convenience and cost-efficiency.
 Catherine
India CBI has arrested an individual from Ahmedabad in connection to a $0.93 million cryptocurrency fraud.
 Hui Xin
In the aftermath of the $193M JPEX scandal, Hong Kong's customs department is taking proactive steps to bolster their cross-border anti-money laundering initiatives.
 Kikyo
KikyoUpland, a blockchain-based real estate game, secured $7 million in a recent funding round, with EOS Network Ventures leading the way.
JasperHuawei introduces OceanStor A310 at GITEX GLOBAL 2023, a deep learning data lake storage, making its foray into the AI storage landscape and offering solutions to tackle pervasive challenges in data processing.
 YouQuan