Author: BitMEX
Source: BitMEX
This article is an excerpt from BitMEX's latest cryptocurrency research report. In this post, we’ll take a look at Bitcoin’s historical bear market and distinguish it from what we consider to be two distinct phases of a classic bear market.
Price-Based Surrender vs. Time-Based Surrender
Looking back at previous Bitcoin bear cycles, two distinct capitulation phases can be seen:
The first is price-based capitulation, where crypto assets are down 70-90% from their previous all-time high after a series of sharp sell-offs and liquidations.
The second, and less mentioned, stage is time-based capitulation, where the market finally begins to find a balance between supply and demand in a deep bottom.
We'll walk through both phases using visual diagrams and data.
Bitcoin retreats from all-time highs
While much has been written about the macroeconomic backdrop for the Bitcoin market, the irony is that this Bitcoin cycle is no different from past cycles.
As of press time, the price of Bitcoin is 69.72% lower than its previous all-time high, with the peak decline reaching 71.86% on May 18. Bitcoin’s past bear market losses have been 93.08%, 84.82%, and 83.47%. With that in mind, while the absolute size of this downturn exceeds that of previous cycles, it is relatively nothing out of the ordinary for Bitcoin.

The other main thing we analyze is the Realized Price/Market Cap metric. Realized market cap adds up the price of each bitcoin when it was last transferred on-chain to arrive at a bitcoin's "fair" value, or realized price, "average" cost basis.
Every major drop in Bitcoin’s history has seen the price break above realized price levels, which means that on average, Bitcoin holders are at a loss based on the last price per Bitcoin (strictly UTXO) transferred state.
Despite Bitcoin’s parabolic gains over longer time frames, we see this as a classic price-based capitulation event when the average Bitcoin holder is losing money.
We can also look at net unrealized profit/loss (NUPL) to quantify the relative size of the capitulation that has occurred. NUPL refers to the difference between Relative Unrealized Profit and Relative Unrealized Loss in the Bitcoin market.

Following a market crash, Bitcoin price below the average holder average cost basis is what we consider a time-based capitulation event. The chart below shows how long the Bitcoin price was consistently below the average holder cost basis (realized price) during previous bear market cycles. Since the assets of ordinary holders are in a state of loss, most marginal sellers have sold their assets. Although there may be further declines, the "pain" felt by market participants comes from the long-term loss. Not the rapid price declines at the start of a bear market.

It is also worth noting that the average cost basis (realized price) declines as prices fall and market participants lose money in capitulation. The chart below shows the history of Bitcoin's realized price declines, helping to clarify the decline in Bitcoin's "fair" value.

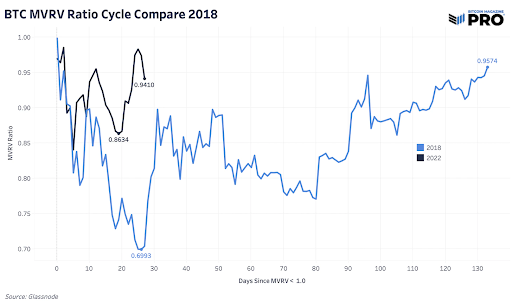
Bear market cycles take time to end, and the length depends on how you define those cycles. Looking at the other three key bear market cycles, which are measured by the market cap to realized value ratio, the price spent an average of 244 days below the realized price. (This estimate excludes the third bear market in March 2020.) Currently, prices have been below realized prices for less than 30 days. This is of course a small sample size across the Bitcoin cycle, but it gives us context for the length and duration of previous bear markets.
The 244-day blended average of the previous time-based capitulation period (an extended period below the average market participant's cost basis) would see Bitcoin recover above realized prices in early February 2023.
Using this framework, it is also possible to see how much lower Bitcoin has been from realized prices in previous bear cycles. The chart below shows the percentage drop below the realized price.

While percentage declines continue to become less severe relative to the average holder's cost basis, past performance is not indicative of future returns. Statistics such as realized prices help to develop a framework for market participants to assess the range of future possibilities.
At this point, we show how Bitcoin's current path compares to previous bear markets, mapping Bitcoin's price relative to realized price (market value to realized value ratio), providing readers with a hypothetical scenario for ending today's question. Shown first is the ratio of market value to realized value for two periods, starting at the moment when the price fell below the average holder's cost basis. The second graph shows the exchange price of Bitcoin today.


Nine times out of ten, the shock of the biggest capitulation event in Bitcoin history just happened. More balance sheet crises are definitely brewing (rather than hiding under them), and the macroeconomic environment is looking increasingly ugly. Holders should be prepared not only for a more severe market downturn, but also for a more painful and prolonged sideways move as Bitcoin moves from weak hands to strong hands, from the impatient to the convinced operate.
Bitcoin is here to stay, and your job is to survive.
 Huang Bo


