$OM (Mantra) plummeted nearly 95% in one day, accompanied by a series of highly unusual yet obvious market events. I have checked the data, collected as much information as I could, and in this analysis, I will walk you through what I think happened.
I’ll explain:
why OKX was not the source of the sell-off (even though that’s the first accusation I’ve heard),
why someone was selling $OM so aggressively like there was no tomorrow,
and how a wallet that started staking $OM 448 days ago may be directly linked to this event.
In this first section, we’ll focus on analyzing market microstructure and how to properly analyze events like this. Later, I’ll outline how this whole situation may have unfolded — and who may have played a key role.
Let me be clear: this was not a “normal” sell-off — even by crypto standards. It was massive, chaotic, and, in my opinion, pushed several participants to the brink of liquidation. This is clearly visible in the order books and trade flow.
Also, this is just my personal take on events. These are not allegations, and I do not expect you to take anything here as absolute truth. It is likely that no one, except a few insiders, knows exactly what happened.
I hope you will read this article critically. If you find any inconsistencies in my logic or analysis, please point them out. I share this article in good faith to show how to handle complex trading events - and of course, because I enjoy doing so.
Quick Overview
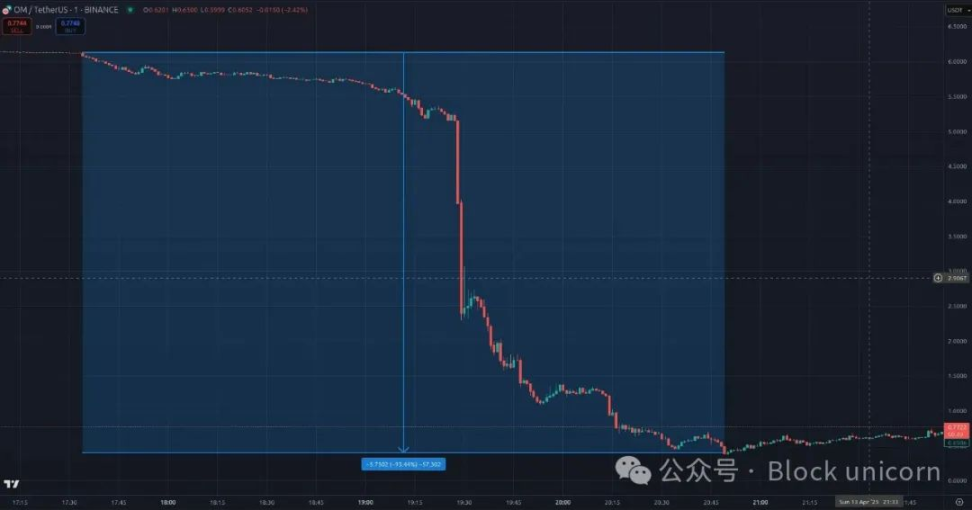
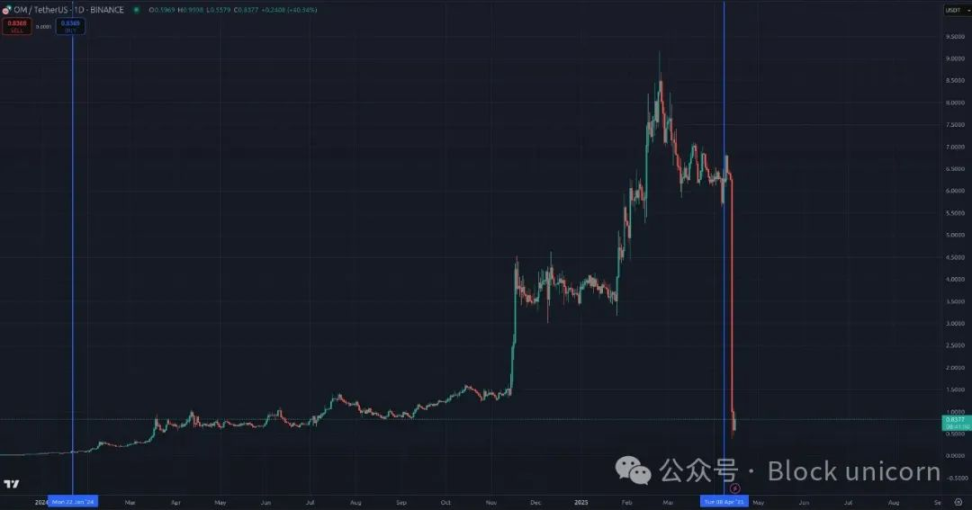
On April 14, 2025 at approximately 19:30 UTC, $OM (Mantra) experienced a massive sell-off, and this token was listed on almost all major exchanges - including the perpetual contract market, which is an important detail.
Before the crash, $OM was in the top 25 by market cap. In just a few hours, it lost nearly 95%, including a drop of nearly 90% in a single hour.
This kind of movement is shocking even for a low-cap altcoin ranked outside the top 2000, let alone a top 25 coin.
Market Microstructure: Where It All Starts
We will focus primarily on those key moments where the biggest drops occurred. Let's take a 3-minute interval, which I will divide into three parts for clarity.
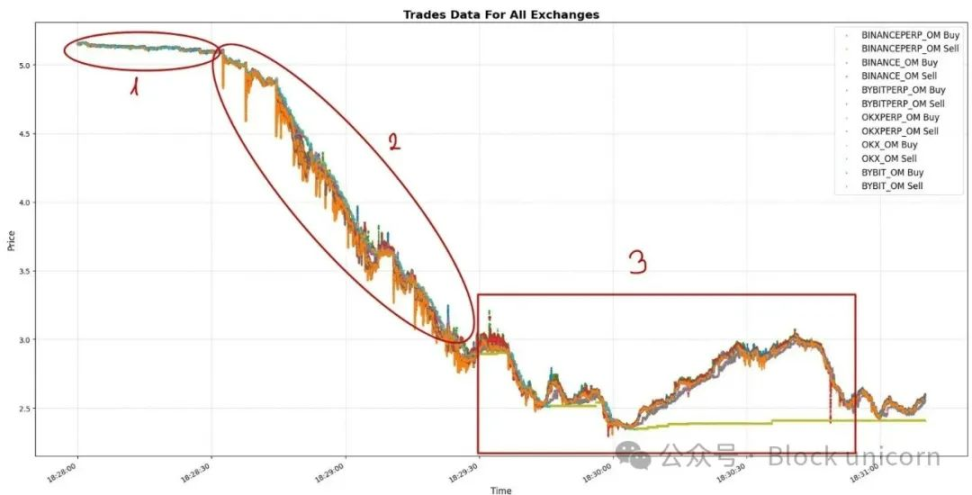
In the first part, there was slight but notable selling pressure. It was mainly concentrated on Binance and Bybit (perpetual contracts) because these markets provide the easiest way to get sell-side exposure.
Remember - you don't need to hold spot coins to create selling pressure. Perpetual contracts are actually better tools for getting large directional exposure, especially because they have deep liquidity and leverage.
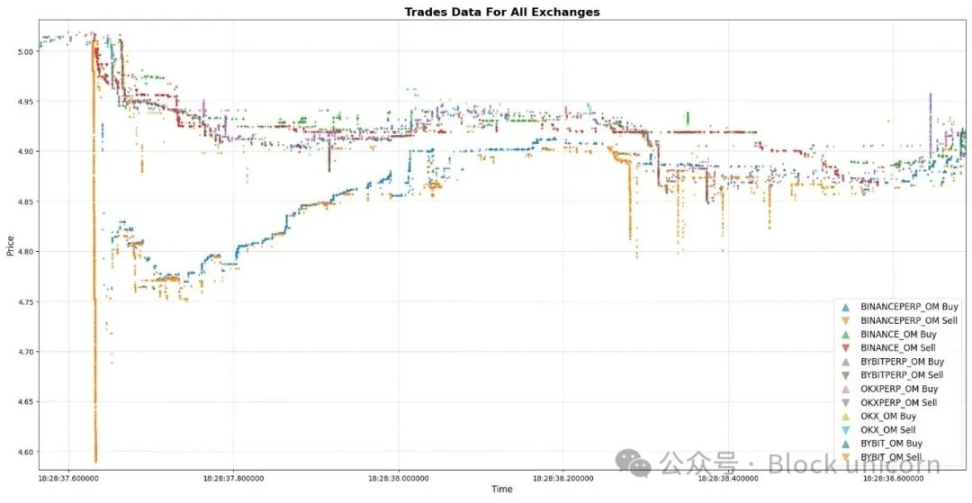
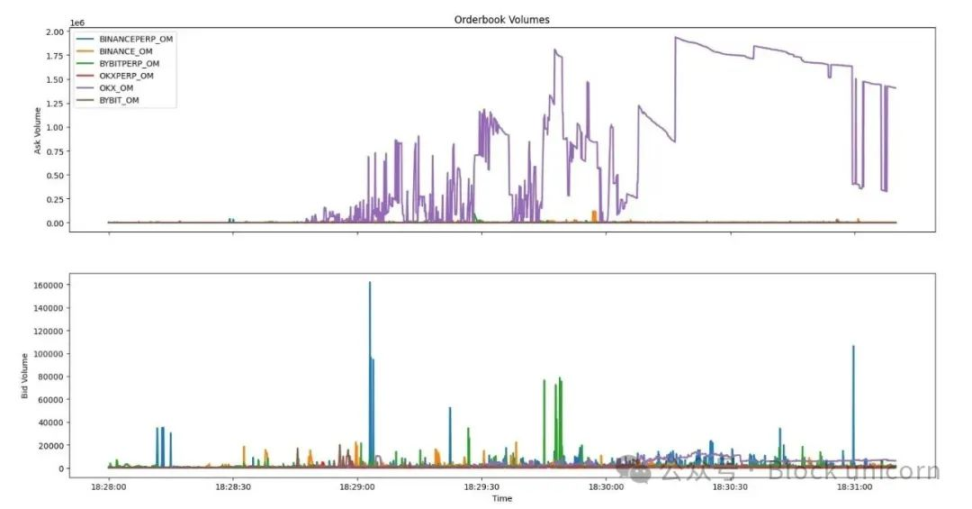
The second part is the most important in the whole move, so let's zoom in.
First, the big picture:
Despite the deepest liquidity on the Binance perpetual market, market shocks — price moves triggered by a single market order — are much larger there than on other exchanges.
This tells us a few things:
Those who orchestrated this sell-off were primarily active on Binance perpetuals. Why? There are likely two key reasons:
Every price move was initiated by Binance perpetuals — they always lead the action (we’ll get into that in more detail later).
Despite deep liquidity, market shocks were huge, leaving other market participants little time to react or cancel their orders. Here is the most detailed data:
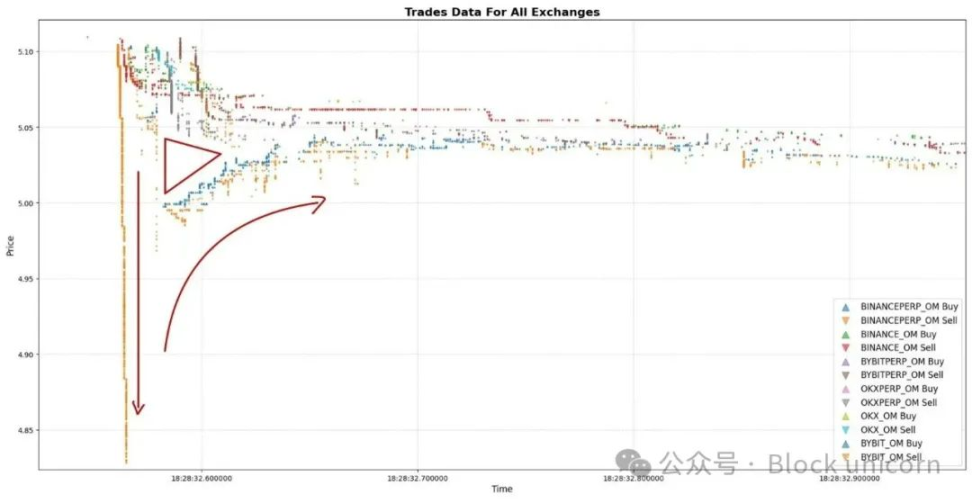
What you see here is a classic example of High Frequency Trading (HFT). Someone has the ability to short on a massive scale relative to market liquidity. In some cases, we see ~$1M worth of trades every 5 seconds (18:29:00, 18:29:10, 18:29:15).
Okay, we have a market participant with a lot of money, shorting $OM like there is no tomorrow. Obviously, each market order creates a huge market shock (~5%), but it is only temporary - a momentary shock.
What follows is a reversion of price to short-term equilibrium. This process creates liquidity gaps (triangles) between exchanges, with one venue trading significantly below fair market price.
That’s why most of the flow after every large market order on Binance Perp is simply looking for equilibrium or signaling to other exchanges.
Even though there is solid selling pressure across the market, there is only one real driver - someone on Binance Perp triggering every tiny (not so tiny) move in $OM.
We see a lot of similar situations. As you can see, the pattern is almost always the same: Binance Perp first, then other exchanges. The pattern is the same: we see a large instantaneous market shock, followed by a liquidity gap, and finally a short-term equilibrium.
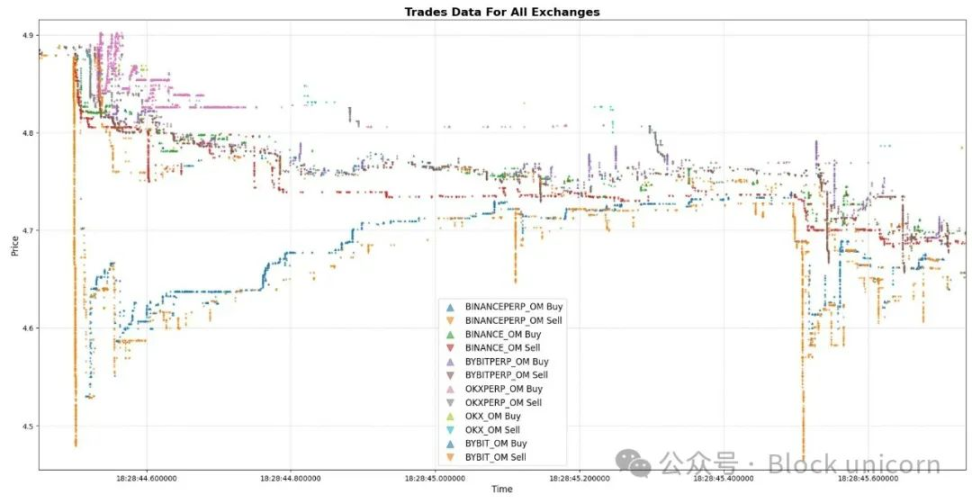
Again - same pattern. Hope you enjoy these kinds of charts as much as I do, because honestly, I get a little excited when I see something like this. It's like pure art.
After a series of similar situations, we have reached a point where nearly 4 million $OM were shorted in a completely unprofessional, dirty, and messy manner. This attack was clearly designed to be fast, brutal, and without regard for cost.
But things get really weird from here.
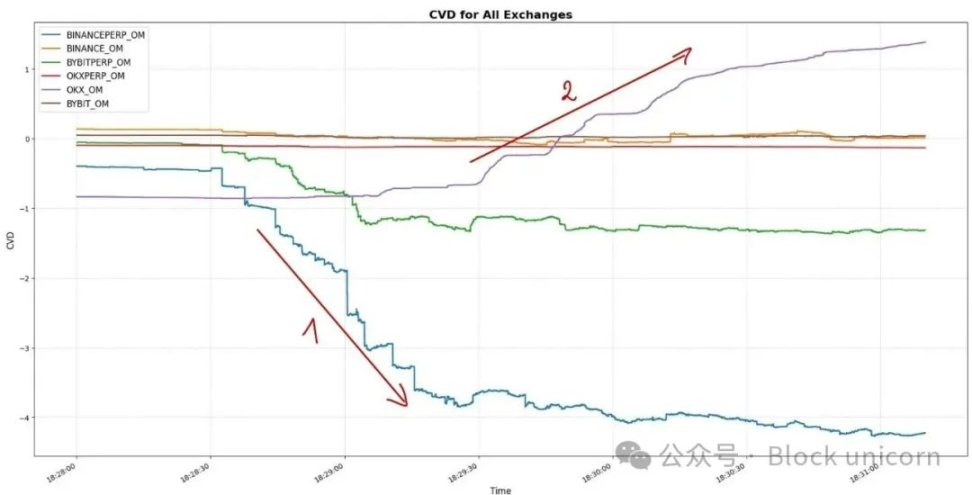
You can see on our CVD screen (Cumulative Volume Difference) that the CVD for Binance perpetuals is -4m $OM, while on OKX - after Binance hit the bottom - the CVD keeps climbing.
Unfortunately, this is one of those moments where the data misleads you. And not just you, but a lot of very sharp analysts have been misled.
This is exactly why I’m posting on X today: it’s extremely difficult to draw clear conclusions from trading data. The data is almost always incomplete. You don’t know who the market participants are or what their intentions are. You only see the numbers at face value, and your mission is to get as close to the truth as possible.
Now I can tell you this with confidence: in the next two minutes, an OKX participant will dump their tokens in such an aggressive manner and on such a scale that it may be different from anything you have probably seen before.
Buckle up — things are about to get more exciting.
Let’s take a look at the third section of our initial chart.
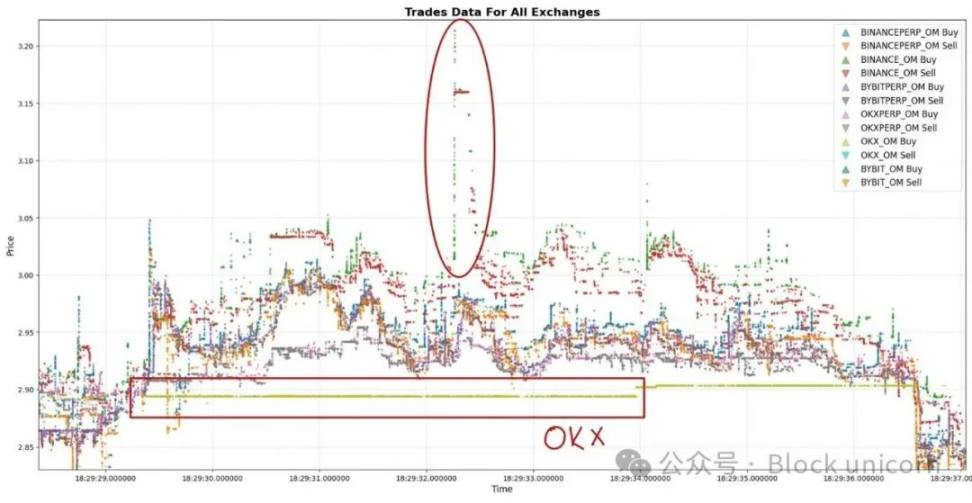
One minute after the sell-off began, the price had already fallen 50% from the starting point — and suddenly, someone appeared out of thin air. Let's call them the OKX OM-whale.
This whale starts placing fillable limit sell orders a few percent below the top of the order book. Boom - then you start seeing trading on OKX at far lower levels than on other exchanges.
You already know why, right? There's a giant limit sell order there - millions of $OM waiting to be sold.
This is exactly why CVD is positive. Not because people are buying like crazy - it's because one player is selling like crazy and everyone else is just taking profit: they buy spot on OKX and short perpetuals or spot somewhere else.
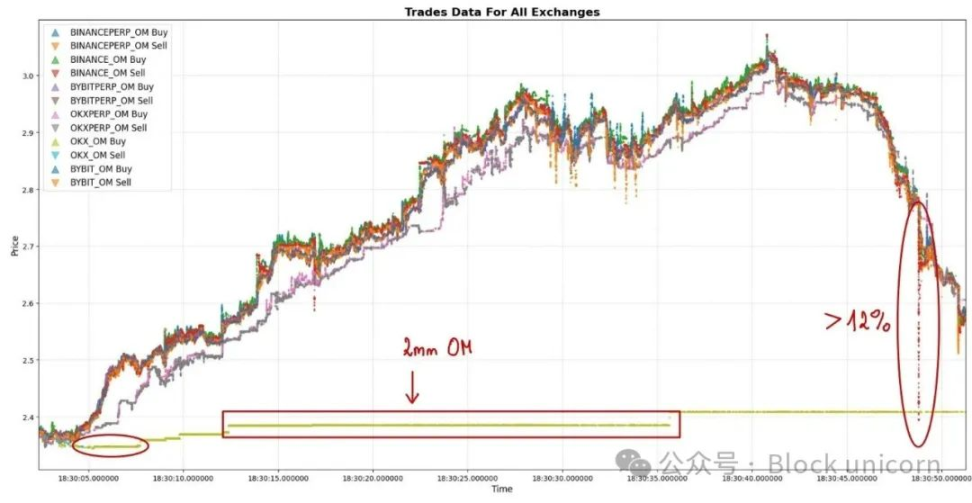
There was even a single limit order for 2 million $OM that fixed the price of OKX for a full minute. That’s the only reason you see positive CVD.
It’s not because people are buying like crazy — it’s because (probably only one) market participant is selling with all his might.
Here you can see the order size by exchange for the top 10 levels of the order book.
Notice all the outliers? Yep, it’s always OKX on the sell side.
Okay, let’s analyze this. We may be left with two options:
Either this market participant was forced to sell (or they would be in serious trouble), or they knew exactly what was happening and understood that it was time to completely liquidate their position. These fillable limit orders don’t look like they were planned or algorithmically executed. It feels like a quick, do-or-die decision made within a minute of the sell-off starting — by someone who had no choice.
The second possibility? They knew something about $OM. When they saw this sell-off, they realized it was the beginning of the end — and got out while they still could.
“But how could this happen?”
There are several theories floating around on X. One of the more interesting theories is that someone on the $OM team reportedly encouraged trading firms to provide them with USDT loans with $OM as collateral.
What does this have to do with the actual situation?
Imagine this:
You borrow USDT, with $OM as collateral
You deposit USDT on Binance
You short $OM via perpetual contracts - not gracefully, but on such a large scale that it crashes the market, causes chaos, triggers liquidations
and ultimately causes a 50% drop in price
This is a logical scenario.
Is this what happened? No.
We have no proof - this is just snippets and patterns of behavior.
OKX OM - Whales could be:
People forced to sell due to loan terms or risk limits
Participants in the attack
Or even an OTC firm that made a ton of money on $OM before, didn’t fully cash out, and suddenly realized that things had to take immediate action when things went bad
Here’s the really weird part:
Look at this Ethereum wallet → 0xebb8...77d2 It started staking $OM 448 days ago, and started claiming rewards six days before the crash.
Let’s look at the chart.
The timing is very coincidental. The wallet is associated with multiple transfers and other wallet networks. But somewhere on the chain - after a few hops - we found wallet 0xB37D...f26A, which is associated with a wallet called "OKX deposits".
It is very likely that the wallet that started staking 448 days ago and claimed rewards a few days before the crash was the same actor who placed aggressive fillable limit orders on OKX.
Also, let's not kid ourselves - Binance likely knows who executed this attack. According to the data, market participants who slammed their order books on Binance perpetual contracts were the primary driver of the entire sell-off.
That’s it for now. It’s really crazy to think how much time I spent just to walk you through a three-minute trade. But this kind of research should be done if you want to truly understand (or at least get close to) the truth - not just in the trading world, but in any field.
Finally, I want to thank a close friend (whose name I will not reveal for reasons). He has been a great discussion partner and helped me think through some of the trickiest market events - including this one.
He’ll know I’m talking about him. So, thank you very much.


 Joy
Joy

