Author: Yashu Gola Source: cointelegraph Translation: Shan Ouba, Golden Finance
The recent "golden crosses" of Bitcoin have triggered sharp rises, but there are also failed examples, such as the "bull trap" in February 2020.
Key Points:
Bitcoin is approaching a "golden cross" signal, which has triggered 45%-60% price increases in the past.
Fundamentals, such as rising M2 money supply and easing trade tensions between China and the United States, support the bullish outlook.
However, technical “bearish divergences” and overbought conditions could still cause Bitcoin to fall below $100,000.
Bitcoin could confirm a “golden cross” on the daily chart by the end of May - a technical pattern that has generally signaled rising prices in the past few years.

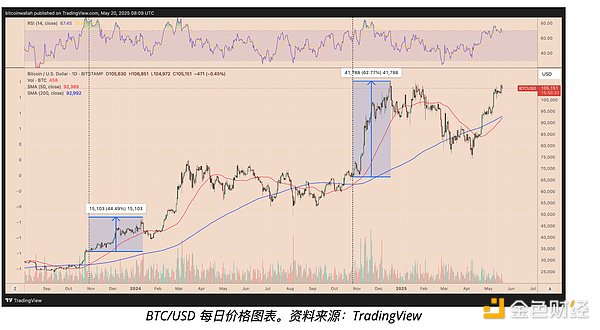
Previous golden crosses have brought 45%-60% increases
As of May 20, Bitcoin’s 50-day simple moving average (50-day moving average, red line) is close to breaking through its 200-day simple moving average (200-day moving average, blue line). If the cross is completed, it will be the first golden cross since October 2024.

The last time this pattern appeared, the price of Bitcoin rose by more than 60%, with Trump's re-election as the US president becoming one of the important driving forces.
In October 2023, the price of Bitcoin rose by 45% after the golden cross, and the main driving force for the rise at that time came from the market's optimistic expectations for the Bitcoin ETF. In September 2021, when a similar moving average crossover occurred, the price of Bitcoin also rose by about 50%.
Golden cross may also "fail"
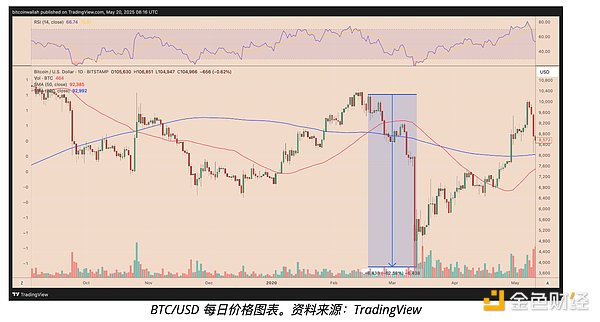
Of course, historically effective technical indicators are not guaranteed to work every time.
For example, in February 2020, Bitcoin also had a golden cross, but then plunged 62% in the market crash caused by the global lockdown of COVID-19. This event reminds us that the macro environment and the possibility of black swan events cannot be ignored when interpreting technical signals.

Current fundamentals are positive, but technicals show a risk of a pullback
For now, the upcoming golden cross is supported by most fundamental factors and tends to constitute a bullish technical signal.
For example, the increase in the US M2 money supply and the easing of Sino-US trade relations have increased market bets on Bitcoin to hit new highs.
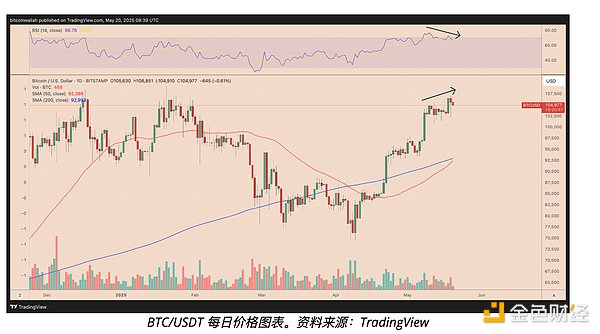
However, it is worth noting that Bitcoin's Relative Strength Index (RSI) broke through 70 in early May and entered the overbought area, and is currently showing certain correction signals.
Therefore, after this golden cross, Bitcoin may not rise sharply immediately, but first pullback to the support level, that is, the $92,400 to $95,000 range where the current 50-day and 200-day moving averages are located.

Meanwhile, Bitcoin prices continue to rise while RSI gradually declines, forming a bearish divergence, which further increases short-term downside risks. However, despite short-term technical risks, some indicators still show that Bitcoin prices may rise to the $150,000 level in the coming months.
 Kikyo
Kikyo


