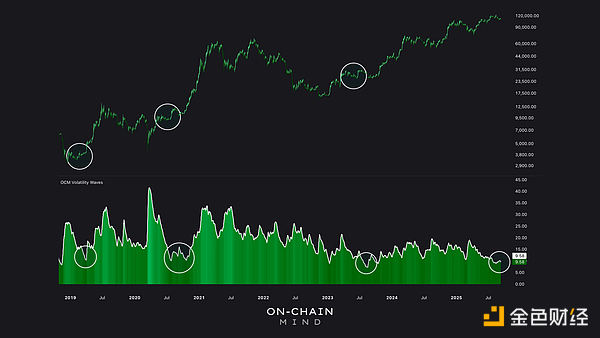
Source: On-Chain Mind, compiled by Shaw Jinse Finance. Bitcoin's volatility is currently in the lowest weekly range since 2015, at 5%. But the question is simple: should we be worried? Or is this calm simply a precursor to the next important phase for Bitcoin? In this article, we explore the nuances of Bitcoin's evolving volatility, introduce advanced metrics like "market entropy," and reveal that these quiet periods often hold the greatest opportunities. Key Points at a Glance Volatility Compression: Bitcoin's price fluctuations are consistent with those of traditional assets like gold and US stocks, demonstrating its integration into the global financial ecosystem, rather than its isolation. Volatility ≠ Risk: Low volatility doesn't equate to safety, nor does high volatility spell disaster; the real risk lies in permanent loss, which Bitcoin's risk of permanent loss is currently negligible compared to the risk of fiat currency devaluation. Entropy is Opportunity: High market entropy (a measure of the disorderliness of price fluctuations) often precedes major trends, turning chaos into a predictor of bullish breakouts. Historical Precedent: Periods of low volatility have repeatedly spring-loaded to power significant Bitcoin rallies, highlighting the need for vigilance during these periods. A Return to Calm Since 2020, Bitcoin has undergone a profound transformation: Volatility has steadily declined. This is no coincidence, but a sign of market maturity. To quantify this, let’s look at rolling annualized volatility, a standard metric that measures the standard deviation of price changes over a one-year period, adjusted for annuality: Bitcoin: 30% Gold: 14% NASDAQ 100: 12% S&P 500: 10% 10% IMG src="https://img.jinse.cn/7398135_watermarknone.png" title="7398135" Volatility remains roughly comparable, but risk-adjusted returns still clearly favor Bitcoin. This compression in volatility reflects Bitcoin's growing maturity in global finance. It's no longer a niche speculative asset; it's behaving more and more like an integral part of the broader financial ecosystem. When evaluating Bitcoin's behavior today, we must consider macroeconomic cycles, the dynamics of risk appetite and risk aversion, and correlations with traditional markets. This compression in volatility raises intriguing questions: Is Bitcoin taming itself, or is the market simply pausing? History suggests it's often the latter. Periods of low volatility often precede significant price increases, and investors who mistakenly believe these conditions will persist forever may miss out. Volatility ≠ Risk One of the most ingrained misconceptions in Bitcoin/cryptocurrency investing is equating volatility with risk. Let me clarify: Volatility measures the magnitude of price fluctuations over time (or a statistical measure of return dispersion). Risk assesses the likelihood of permanent capital loss or a catastrophic event. In its early days, Bitcoin faced a real existential crisis. (If you remember back then, there was a heated debate about its survival, adoption, and long-term relevance.) Today, Bitcoin boasts millions of users, institutional investment, and even widespread adoption by nation states, making its potential disappearance almost negligible. Nevertheless, some risks remain: 51% attacks are theoretically possible; and quantum computing could eventually challenge Bitcoin's cryptographic protocol. But compared to fiat currencies, such as the US dollar, which loses 8%-10% of its purchasing power annually due to inflation and money printing, and whose value is inevitably devalued by central bank policies, the risk, in my view, is already quite high—an inevitable loss of capital. On the other hand, Bitcoin has achieved a 1,000% return in every five-year cycle since its inception, outperforming not only inflation but even the US stock market. To me, Bitcoin is beginning to emerge as a long-term "safe haven" asset—a store of value unaffected by currency devaluation, making temporary fluctuations less of a concern from a broader perspective. Riding the Waves: Volatility wave charts visualize short-term cycles by applying 7-day realized volatility and smoothing it with an exponential moving average (EMA). This transforms raw price fluctuations into easily understandable "waves," highlighting underlying trends.

A ‘calm’ is often a precursor to a ‘storm’
Even during periods of low volatility, sharp swings can still occur.
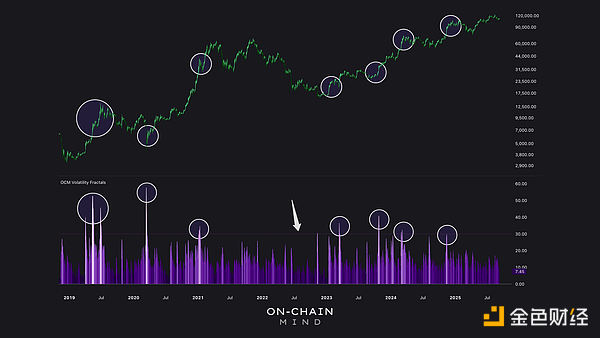
Bitcoin's historical patterns show that quiet periods of consolidation often presage explosive moves. These moments aren't inherently risky—they represent a buildup of latent market energy, waiting to be unleashed. These "coiled spring" phases often lull the average person into complacency. Here's how it works: Liquidity increases, whales accumulate, shorts pile in, and then a catalyst unleashes pent-up energy. Bitcoin's asymmetry is highlighted here: downside spikes are sharp but brief, while upside moves tend to be long-lasting. Volatility Fractals—Convergence and Breakout Signals Volatility fractals use fractal pivots (which outline local highs and lows in market volatility) to identify volatility clusters. This approach measures the strength of current volatility relative to recent structural points, providing a dynamic sense of market concentration. Any reading above 30 is considered "high volatility" - requiring close attention for potential mean reversion opportunities.

Light Purple: Volatility is more clustered.
Dark Purple: Indicates a milder, calmer environment.
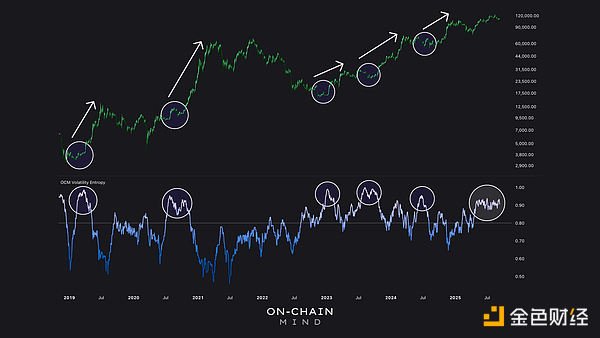
A notable threshold occurs around a reading of 30, marking the moment of a major breakout—either up or down. Historical peaks coincide with significant market events, including major rallies and declines (see chart above). Contrary to popular belief, the involvement of institutional investors—such as exchange-traded funds (ETFs) and corporate treasuries—has not dampened Bitcoin's price volatility. Even after Wall Street's involvement in Bitcoin, volatility fractals suggest that significant price swings will continue. Institutional investors have added liquidity, rather than dampened it; their use of leveraged products has amplified volatility. Consolidation after surges is also common in this cycle, with range-bound trading absorbing recent gains. But this does not mean the price volatility we've known is over. Fractals are a constant reminder that monotony breeds breakouts. Market Entropy: Measuring Chaos Now, bear with me for this last section; it's a little more complex than my usual coverage, but I discovered something quite profound. The metric below is called volatility entropy. My background is in particle physics, so the concept of entropy is quite intuitive to me. But for those unfamiliar, entropy is essentially a measure of disorder, randomness, or uncertainty in a system. This "market entropy" uses concepts from information theory (and thermodynamics) to quantify the disorder and unpredictability in price movements. In physics, higher entropy indicates greater randomness, while lower entropy indicates greater order. In the market, we can observe:
High entropy: chaotic price trends and unpredictable market behavior;
Low entropy: orderly trends, stable accumulation and predictable price fluctuations.
Look at what this chart illustrates:

High readings of market entropy are often associated with increased market uncertainty and volatility, and are usually followed by a sharp rise. The current extremely high reading suggests that the market is ripe for a sustained trend
For those technically minded - this indicator bins log returns into discrete bins and calculates the rolling Shannon entropy over a defined window, giving a standardized measure of market disorder.
Why I Measure Market Entropy:
Opportunity Hides in Chaos: History's largest price increases have followed periods of high entropy.
Markets Seek Order: Chaos is temporary; human behavior naturally gravitates toward predictable structure.
Current Context: High entropy since May 2025 indicates widespread market uncertainty, with no consensus on direction.
From a practical perspective, entropy can help us predict when periods of calm or chaos are likely to end, often signaling the emergence of major trends in the coming months. My View on the Current Market Right now, Bitcoin seems to be holding its breath. Volatility has declined over the past few years, but beneath the calm lies a market poised for action. Waves of volatility indicate a quiet buildup of momentum, while fractals highlight areas of concentrated activity—breakouts could come from anywhere. Complacency is dangerous at this time; the market could swing wildly in one direction, catching those expecting the status quo off guard. Remember: 80% of Bitcoin's gains occur in just 10% of trading days. What truly struck me about this article is the market's entropy. We are in a period of extreme chaos, and such chaos rarely lasts long. When entropy spikes, human behavior kicks in. As investors, we crave predictability, and once patterns begin to emerge, trends accelerate rapidly. Historically, high entropy has been a precursor to large swings, and the market is teeming with the possibility of such activity right now.
Institutional investors haven't tamed Bitcoin—they're sharpening it. ETF flows, corporate treasury allocations, and leveraged products create pockets of concentrated liquidity that amplify, rather than dampen, volatility. This means that when a trend finally takes hold, its momentum is likely to be very strong.
For me, now is not the time to hesitate. It's time to pay close attention, anticipate opportunities amidst the chaos, and be ready to act when the market finally resolves its current issues.
Calm markets can be deceptive; but within the chaos lie the true signals.
 Alex
Alex
 Alex
Alex JinseFinance
 JinseFinance
 JinseFinance
 JinseFinance
 JinseFinance
 JinseFinance
 JinseFinance
 Future
 Cointelegraph