Author: Mr. Beggar Source: X, @market_beggar
Key Points
BTC’s strong cyclicality is inevitably disappearing
The two tops in 2021: The complete defeat of the Kezhouqiujian School
The first time in history: the huge change in the URPD chip structure
Analysis methods and response strategies after the disappearance of cyclicality
The inevitable disappearance of cyclicality
The end of 2013, the end of 2017, and the end of 2021 corresponded precisely to three cyclical tops respectively. This rule that occurs every four years has been regarded as a guiding principle by countless market participants.
However, from the perspective of scientific research, simply copying the old ways will obviously not lead to a rigorous conclusion.
As the impact of halving production decreases and market value grows, there is no longer any view that can stand up to scientific scrutiny and support the four-year cycle theory.
If the cyclicality disappears in the future, how should we as traders respond?
The most powerful group: market participants who hold for 1 to 3 years
Historically, there is a group whose behavior always perfectly corresponds to the bull and bear cycles of BTC. This group is the market participants who hold for 1 to 3 years.
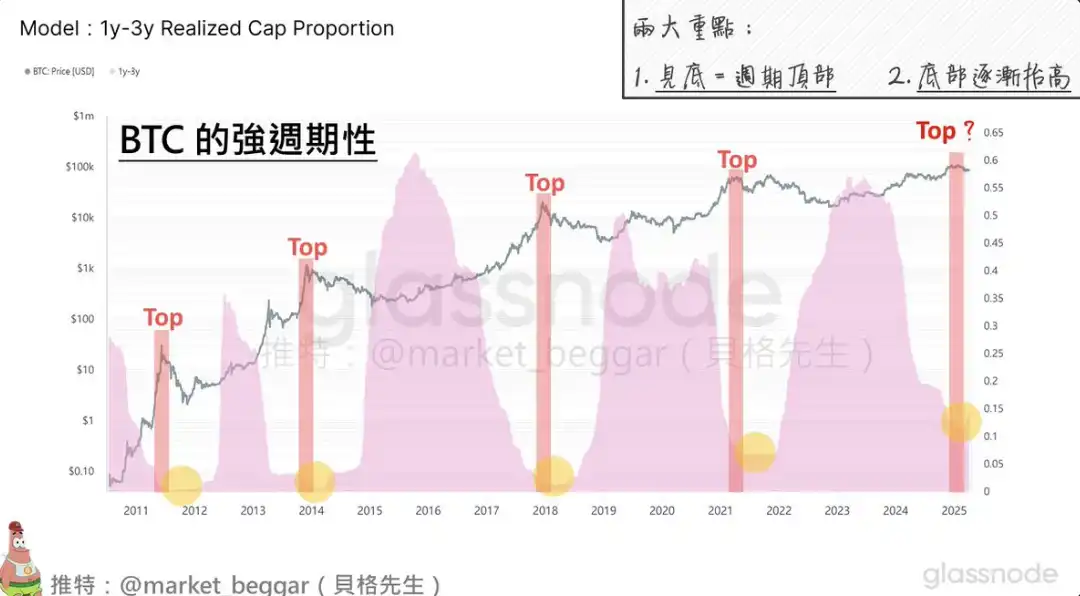
(Chart description: The proportion of market participants with holding time of 1-3 years)
We can clearly see that:
Whenever this proportion hits the bottom, it always corresponds to the top of the price cycle
Whenever this proportion hits the peak, it always corresponds to the bottom of the price cycle
In plain words: every time the BTC price reaches its peak, they just happen to sell out; and every time the BTC price reaches its bottom, they just happen to accumulate a large number of chips.
Which is the cause and which is the effect, it is currently impossible to give an answer, but it is obvious that the emergence of bull and bear cycles is inseparable from them.
There are three points worth noting in this chart:
With each cycle, the lowest value of this proportion is increasing year by year. The reason behind this is not difficult to guess: more and more participants choose to hold BTC for a long time.
Currently, the proportion of this group is beginning to turn to "increase", which echoes my logic of being bearish on BTC since the end of last year.
(For details, please refer to my previous post)
From obscurity to being listed on the US ETF and competing with gold, as BTC gradually comes into the public eye, more people will be willing to hold BTC.
The two tops in 2021: the complete defeat of the Kezhouqiujian School
Previously, I have written several articles specifically discussing the double tops in 2021.
In my article "Revisiting the Double Top in 2021: What is 'Future Data Leakage'?", I clearly pointed out the particularity of the double top in 2021 and explained in detail why we cannot stick to the old ways.
In conjunction with today's theme, I will analyze from another perspective:
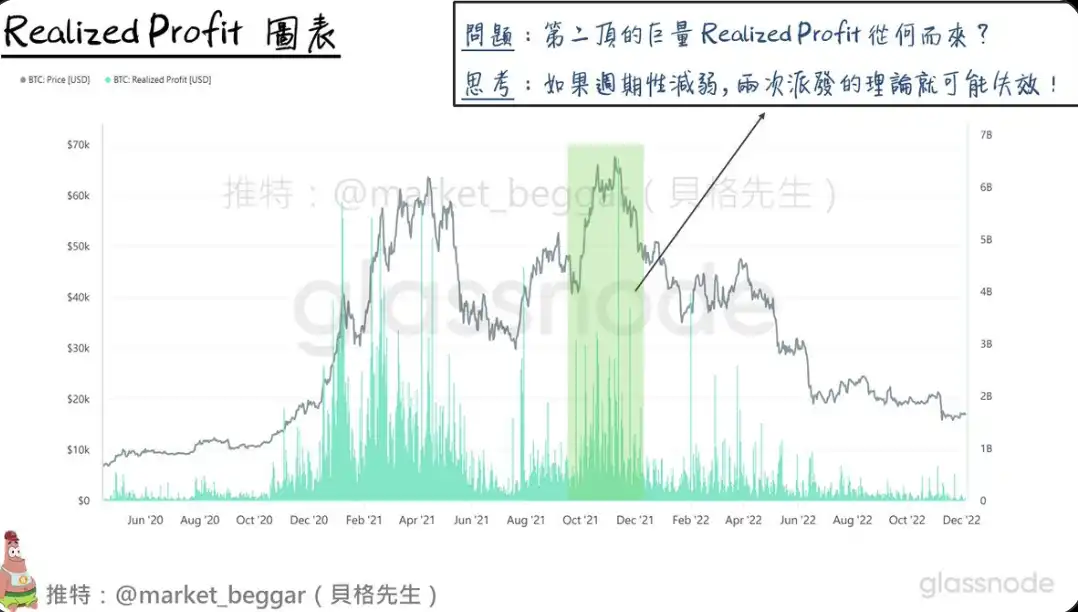
(Chart Description: Realized Profit)
The so-called Realized Profit is based on the principle of UTXO on-chain accounting, and calculates how much profit is taken every day.
I also mentioned in my X-pinned post: Whenever concentrated and huge Realized Profits appear, it means that a large number of low-cost chips are being sold off for cash, which is a major warning sign.
For detailed analysis logic, please refer to this article: Top Signal Tracking: Huge Realized Profit Reappears
From the perspective of on-chain data, this cycle actually ended in April 2021 (the first top); but due to various factors, BTC subsequently created a second top in November 2021.
As shown in the above picture, when the second peak appeared, it was also accompanied by a huge amount of Realized Profit, so the question is: "Where does this huge amount of Realized Profit come from?"
Combined with the first picture, the proportion of the group holding for 1 to 3 years had actually bottomed out in April 2021.
Therefore, the huge amount of Realized Profit that appeared at the second peak can only come from the group that accumulated chips from May to July 2021.
The point worth thinking about is here:
If the cyclicality gradually disappears in the future, will there be more such "short-term bottoming out" and then the start of a new round of main rising waves?
As I mentioned in my previous article, past tops were often accompanied by two large-scale distributions, and this cycle did indeed see a second large-scale distribution in December last year.
But if volatility decreases in the future, can the new bull-bear cycle transition of BTC be completed in just one go?
It's worth pondering.
For the first time in history: a huge change in the URPD chip structure
Next, let’s talk about this topic from the perspective of the chip structure.
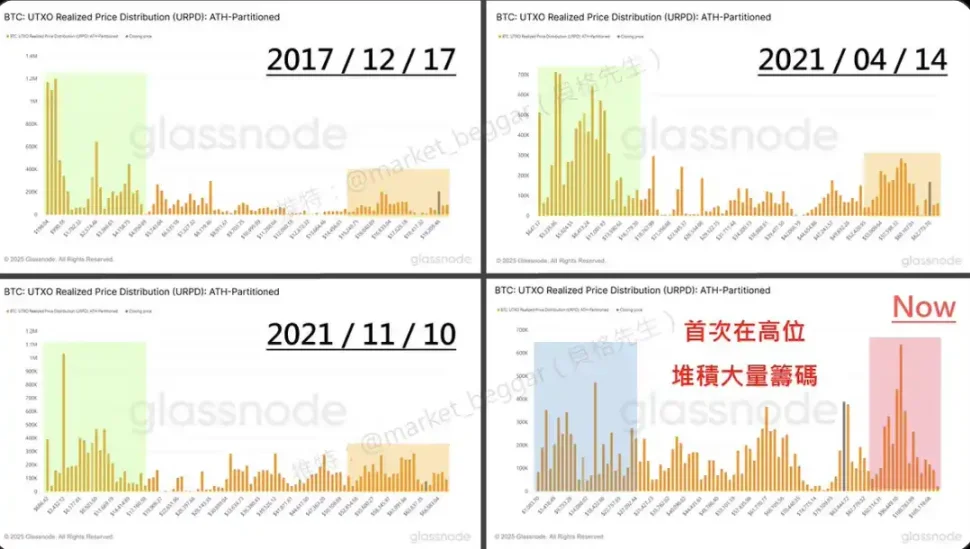
(Chart description: Comparison of URPD chip structure at the top of the past three cycles)
It can be seen that this cycle is the most special one so far.
The reason for saying this is: This is the first time in history that after the second large-scale distribution, a huge amount of chips are accumulated in the top area.
Based on this, we may have to admit that BTC is entering a new era.
Analysis methods & response strategies after the disappearance of cyclicality
If the cyclicality in the future does continue to weaken as expected, then how should we as traders examine the market?
Let me state the conclusion first: Never stick to the old ways and always use the logic of deduction to analyze.
In the young life cycle of BTC, the number of samples is seriously insufficient, which has caused countless theories of the Kezhou School to be overturned one after another.
The copycat season, the inevitable increase in the New Year, the inevitable increase n days after the halving... and so on, are too numerous to list, not to mention the various indicators that were knocked down in 2021.
Therefore, in order to overcome the problem of insufficient sample size, we must ensure the existence of logic as much as possible during the research process.
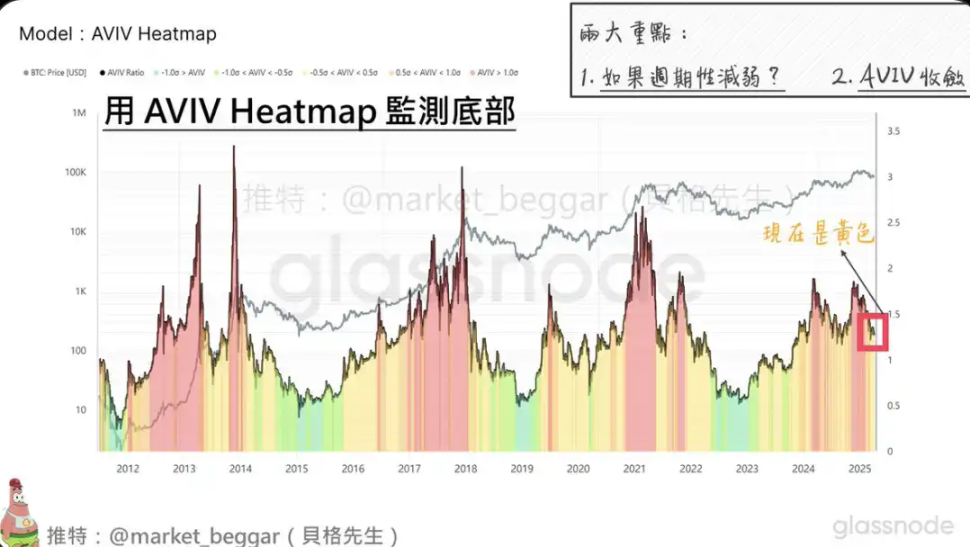
Here’s an example: AVIV Heatmap.
AVIV can be seen as an optimized version of MVRV, which is calculated based on active (rather than completely immobile) chips and excludes the influence of miners.
AVIV Heatmap is one of the models I designed personally. It uses the mean reversion property of AVIV and colors it according to its deviation.
The advantage of this analysis method is that the calculation of deviation takes into account the "standard deviation", and the standard deviation is an indicator that can directly reflect the volatility of BTC.
Therefore, as volatility decreases, the criteria for defining extreme values in the AVIV Heatmap will also be relaxed.
Conclusion
A brief summary:
1. As the market matures, the disappearance of cycles is inevitable
2. Chips held for 1 to 3 years have dominated the bull and bear cycles in the past
3. The emergence of the double top in 2021 announced the failure of the "carving boat to find the sword" methodology
4. The chip structure has undergone unprecedented changes
5. As a trader, you must ensure logic in the research process to ensure the availability of the results
"BTC Still young, it is marching towards the world's attention at an unprecedented pace, and you and I will be witnesses of this historical feast. "


 Joy
Joy

