Author: Martin Young, CoinTelegraph; Compiler: Wuzhu, Golden Finance
Although the cryptocurrency market has been trading sideways for the past three months, at least five on-chain indicators suggest that the bull run may have just begun, according to one analyst.
The total market capitalization of cryptocurrencies has been fluctuating around $2.5 trillion since the end of February. Market observers are conflicted about whether the cycle is over.
As analyst "ELI5 of TLDR" highlighted in an article on X on May 19, these five on-chain indicators suggest that everything has just begun.

Source: ELI5
Bitcoin Market Dominance Exceeds 56%
Historically, cryptocurrency bull runs started with high Bitcoin dominance, with most traders selling altcoins during previous bear cycles.
On the other hand, when BTC’s dominance falls and the alt season begins — it marks the next phase of the bull cycle, bringing it closer to an end — that doesn’t seem to be the case yet.
According to data from TradingView, Bitcoin’s market dominance remains high at just over 56%. Bitcoin’s market share has been above 50% since October 2023.
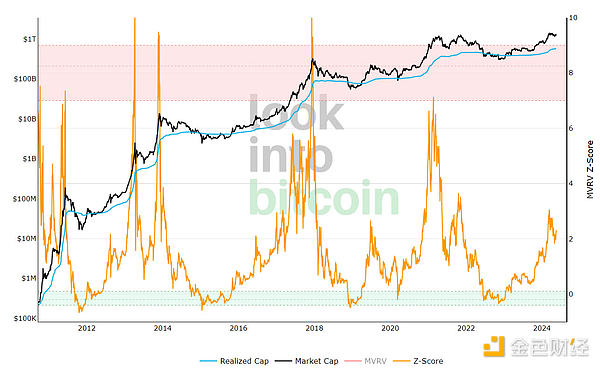
Bitcoin MVRV Z-score below 6
According to a LookIntoBitcoin chart, the Bitcoin MVRV Z-score compares an asset’s current market value, or capitalization, to its historical average, typically peaking at around 6 during the peak of the cycle.
It’s currently less than half that, and hasn’t been above 6 since March 2021, according to data from LookIntoBitcoin.

Bitcoin MVRV-Z score. Source: Lookintobitcoin
Puell Multiple Has Not Exceeded 3
The Puell Multiple is another indicator that is consistent with cycle peaks. The indicator is calculated by dividing the daily value of Bitcoin mined by the annual moving average of that value.
After the April 20 halving, the Puell Multiple fell below 1, according to Coinglass. Peaks above 3 typically coincide with cycle tops, having only reached 2.4 during the 2024 price rally in mid-March.
Holding Waves
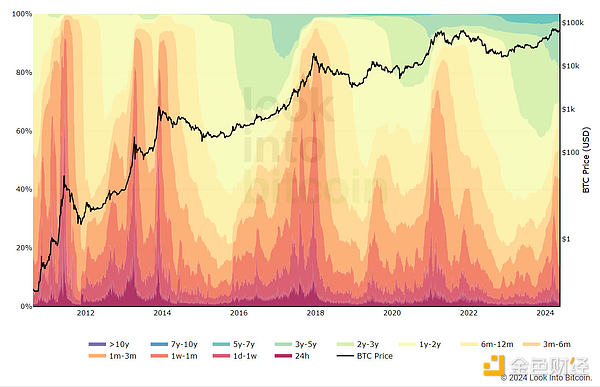
Meanwhile, a chart showing the amount of BTC held by different groups according to holding waves is also bullish for Bitcoin, according to data from LookIntoBitcoin.
The Realized Cap Holding Wave provides a macro view of how much Bitcoin recent buyers are holding compared to the previous period.
The pullback from the peak in the more recent range suggests that selling pressure has been exhausted and there may be room for further gains.
ELI5 added:“More and more BTC new entry [commitment] is less, more likely to see panic selling. Looks like we can still go up.”

Bitcoin achieves cap on holding wave. Source: Lookintobitcoin
Bitcoin Miner Revenue Per Hash
The fifth bullish on-chain metric is miner revenue per hash, which essentially shows how much money miners are making through proof of work.
While it will decline over time as network difficulty increases, ELI5 notes that the past two peaks of $0.30 per second were during previous market cycle peaks.
On the other hand, there are some on-chain indicators that suggest the market may be overheating and reaching a peak.
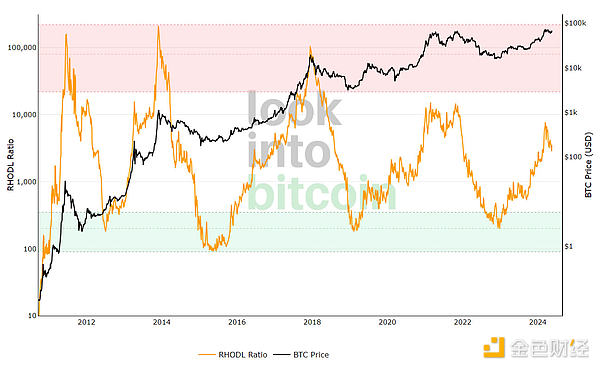
The RHODL (Realized HODL) ratio compares the average price of recently purchased coins to the average price of coins purchased 1-2 years ago. If new buyers are paying much more for BTC than long-term holders, this could be a sign that the market is reaching a peak, as the indicator showed in March.

RHODL ratio. Source: Lookintobitcoin
The cumulative value destroyed days (CVDD) indicator also appears to have peaked. This tracks the ratio of the cumulative sum of value destruction over time as coins transfer from old hands to new hands to the age of the market.
ELI5 said: "If a large number of old coins start to flow at the same time, this may indicate that the market is reaching a top."
As of this writing, BTC is trading at $66,668, down 10% from its all-time high in mid-March.
 JinseFinance
 JinseFinance
 Hui Xin
 Bitcoinworld
 Kikyo
Kikyo decrypt
 Beincrypto
 Cointelegraph
 Bitcoinist
 Cointelegraph
 Cointelegraph