Author: UkuriaOC, CryptoVizArt, Glassnode; Compiler: Tao Zhu, Golden Finance
Abstract
After ATH went through a rather long allocation period, a cooling and consolidation period has begun, and sell-side pressure is weakening significantly.
In addition to weakening seller activity, capital inflows have remained relatively modest, albeit still profit-led, and sufficient to stimulate local price movements.
During this adjustment, various volatility indicators have been compressed, because the situation on the chain has reached equilibrium, so larger market fluctuations usually occur. .
Slowing supply side
A strong Bitcoin market will naturally attract seller pressure, as rising prices prompt long-term holders to allocate some of their holdings quantity. We can see this through the large drop in supply throughout March and April over the 1-2 year period, as the long-term investor base distributes tokens to meet new demand ahead of ATH.
However, The supply held by the 3+ year old investment group continues to increase, indicating that this group is generally waiting for price rise before selling their tokens. As of this writing, more than half of all Bitcoin holders have been in the past two years or more No transactions are performed on the chain.
Last active supply over 1 year: 65.8% (red)
Last active supply over 2 years: 54.9% (yellow)
< span style="color: rgb(0, 176, 80);">Last active supply 3+ years: 46.4% (green)
Last active supply over 5 years: 31.3% (blue)

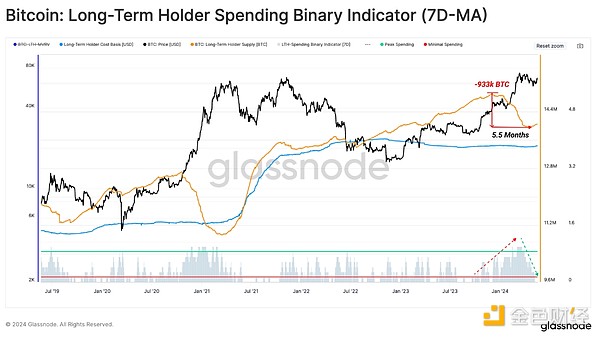
The Long Term Holder (LTH) Binary Spending Indicator is another indicator we can use to analyze and visualize the intensity of holder allocation pressure a tool. We noticed a significant and sustained drop in LTH supply to $73,000 ATH in March.
As of the past few weeks, however, this allocation pressure has eased significantly, giving bulls more breathing room and less overall resistance.
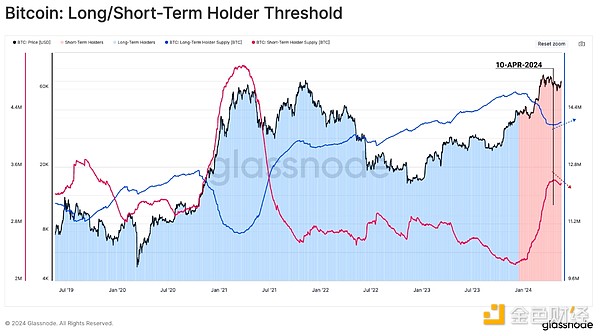
The flip side of LTH’s decreasing supply is a sharp increase in supply held by short-term holders (STH), who represent new investors who have recently purchased the token.
Local disagreements began to arise between LTH and STH Supply, which intensified Allocation pressure among sophisticated investors is cooling.
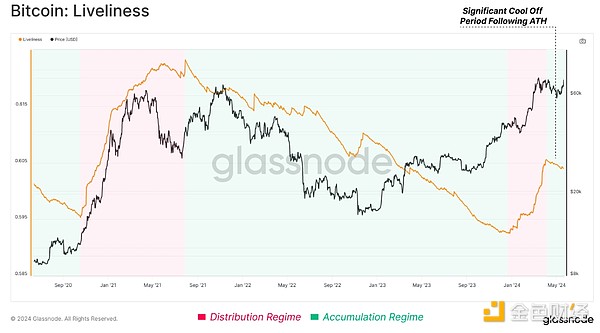
Activity indicators also reflect this change in market characteristics and indicate that the Bitcoin network’s daily creation of Bitcoins is greater than the number of Bitcoins destroyed. In other words, the market now favors holding tokens for the long term rather than actively allocating tokens for profit.
Demand remains modest
Realized Cap is a metric unique to on-chain analytics that measures the cumulative USD liquidity “in storage” within the asset class. It is currently valued at $574 billion.
Currently, new capital is flowing into the Bitcoin network at a faster than peak rate as the market digests the recently allocated supply. Slowed down significantly.
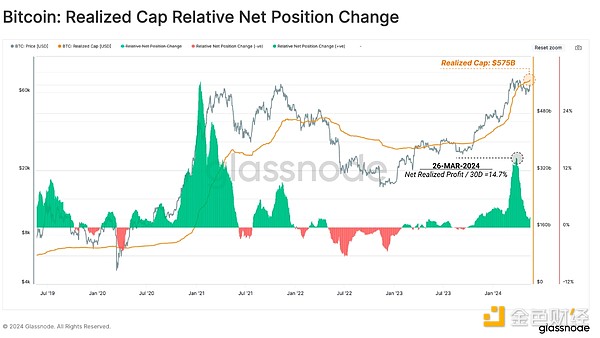
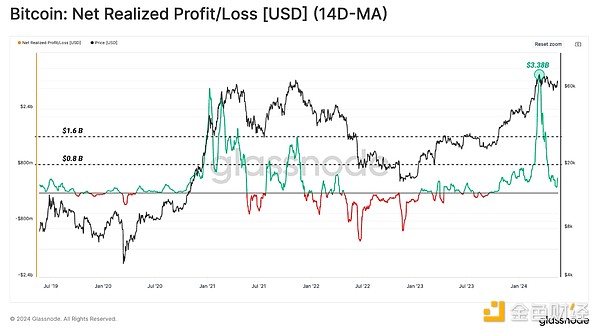
Thus, the daily rate of change in the realized cap can be used as a measure of capital inflows. The recent liquidity injection during ATH was very intense, eventually reaching $3.38 billion/day. This exceeds the peak of the 2021 bull market, which has cooled significantly since then.
Currently, this indicator is still in the positive profit-dominated area and is returning to equilibrium. However, this wave of modest demand was enough to spur price action as sell-side resistance from sophisticated investors subsided.
Volatility Compression< /h2>
As supply-side pressures and capital inflows ease, it becomes prudent to turn to our volatility tools to ground our expectations for where to go next.
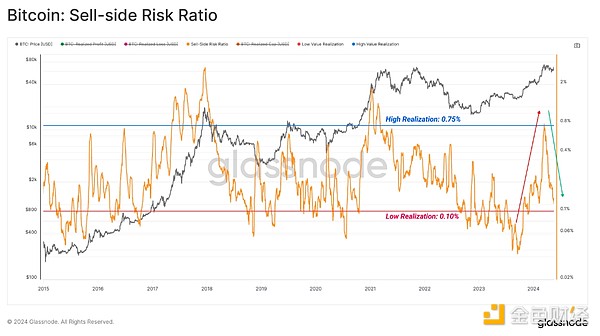
To do this, we can employ the sell-side risk metric, which evaluates the total value locked in tokens spent on-chain (realized profits + realized losses) versus the size of the asset class (realized cap) .
High values indicate that investors are investing relatively Tokens are spent based on larger profits or losses on a cost basis. This situation indicates that the market may need to re-find its equilibrium, and often high-volatility price movements occur.
Low values indicate that most tokens are spending relatively close to their breakeven cost base, indicating that some level of balance has been achieved. This scenario typically means running out of "profit and loss" within the current price range and often describes a low-volatility environment.
We can see that the sell-side risk ratio has declined significantly in recent weeks, suggesting that the market has found some level of balance during this correction.
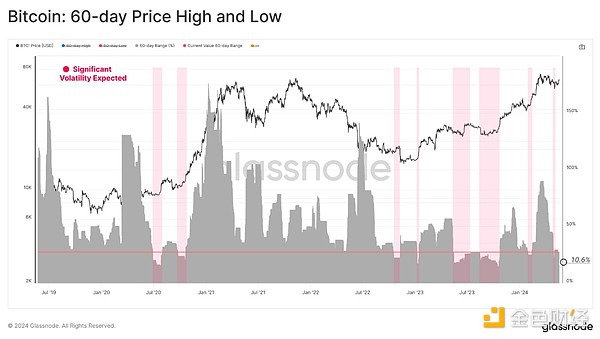
We can also pass Assess market volatility as a percentage range between the highest and lowest price changes over the past 60 days. By this metric, volatility continues to compress to levels typically seen after prolonged consolidation and before large market moves.
Tracking too many investments
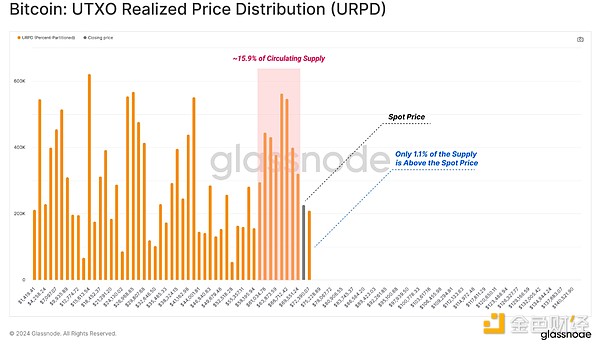
Finally, we can use the URPD metric to assess the density of a token, with its cost basis surrounding the current spot price. We use this concept to identify market sensitivity points, where market movements are likely to trigger a reaction from a large number of investors.
As the price moves toward the end of the distribution, we note that approximately 15.9% of the token supply is slightly below the current spot price, which may provide strong support.
In contrast to the dense cluster of tokens below, Only 1.1% of the circulating supply remains above our current spot prices, suggesting continued inflows of demand could catalyze price discovery for a period of time.
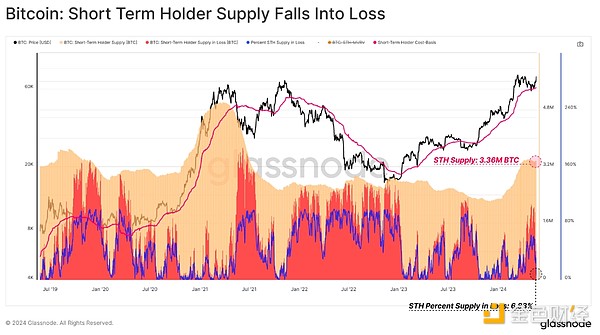
STH supply currently stands at 3.36 million BTC, and during the recent adjustment period, more than 2.14 million BTC fell into unrealized losses (63.2%). However, as the market rebounded above $70,000, this number has dropped to just 230,000 BTC, which is approximately 6.8% of the total.
This shows that although tokens are highly concentrated around the current spot price, there are very few tokens with unrealized losses, which greatly reduces the risk of excessive investment.
Conclusion
Sell-side pressure dropped significantly following a large allocation to $73,000 ATH from sophisticated investors. This results in reduced overhead resistance, allowing even modest demand to spur positive price action.
In addition,Volatility over longer time frames Continued compression, coupled with a dense supply cluster forming below current spot prices, may provide a solid base.
 JinseFinance


