This article positions the enduringly popular Pokémon Trading Card Game (TCG) as a unique durable collectible IP, which is entering the crypto-chain space as a "RWA × Gacha" platform (note: Gacha, meaning card drawing, comes from the Japanese term gachapon), realizing a real economy that combines mobile scale demand with crypto-native distribution. This article covers a wide range of topics, including TCG IP mindshare and asset performance, mobile demand funnels, on-chain platform growth, traffic quality and user groups, unit economic benefits in various scenarios, and risks and catalysts.
Through data research, we have concluded that:
Gacha accounts for more than 90% of the platform's transaction volume;
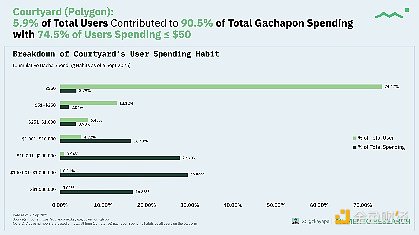
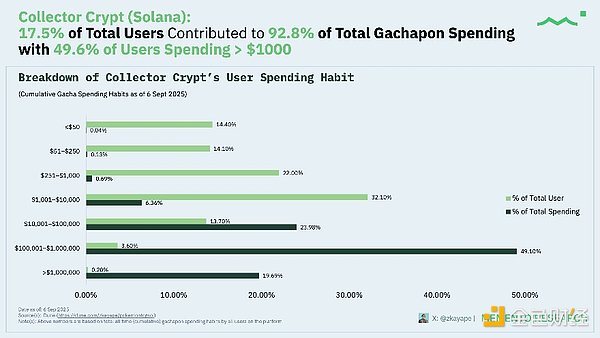
5-20% of users contribute about 90% of the consumption;
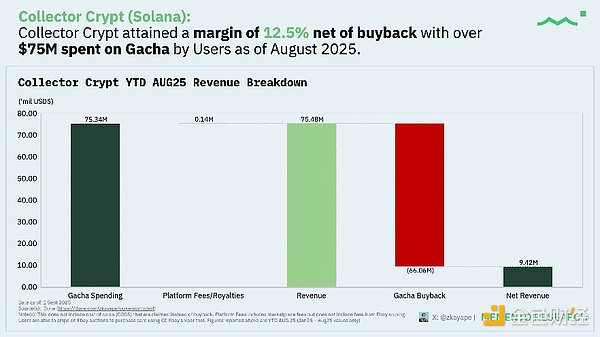
The net commission rate after deducting repurchases is between 12% and 31%.
1. Market Overview and Background
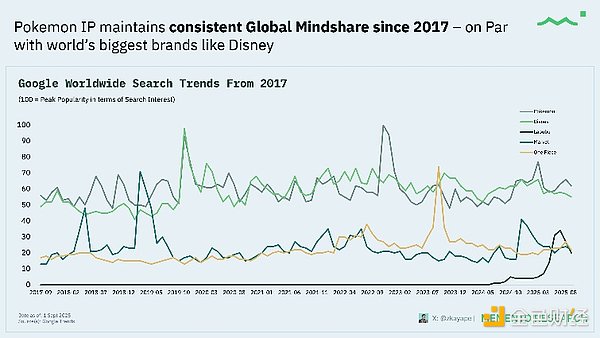
Pokémon continues to maintain a global mindshare comparable to Disney (2017-2025), outperforming other popular fan-driven IPs (Marvel, One Piece, and the recently popular Labubu).
The Lindy Effect states that the longer something exists, the longer its expected remaining lifespan. Sustained interest is crucial for long-term liquidity; it explains why secondary markets don't crash due to short-term macro factors (e.g., watches, rare TCG cards, art, and classic cars). We should be clear: search interest doesn't ≠ spending, but it is a leading indicator of TCG activity, and we'll show how that interest translates into spending later. Since November 2017, the Pokémon Card Index has outperformed the S&P 500 by about 4.7 times, even matching Bitcoin’s performance – with specific events (the Logan Paul hype, the COVID-19 crisis, and the 25th anniversary) fueling this momentum. Pokémon TCG Pocket (TCGP) generated approximately $915.3 million in revenue in six months, significantly surpassing other Pokémon mobile products, while Pokémon GO's lifetime spending ($8.6 billion) confirms the IP's paid base. This demonstrates the massive spending funnel of pack openings and how the gacha mechanic has become a money-making machine. App revenue of $477.5 million in the first half of 2025 (strong performance early in the cycle) demonstrates a "new release explosion effect" fueled by digital card pack openings. Similar to the Labubu phenomenon, this demonstrates the enduring appeal of the blind box economic model—gacha platforms replicate the same behavior with physical cards. Blind boxes and gacha culture originated from Japanese capsule toy machines: randomly obtaining toys or figures from a series, they offer low costs and high repurchase rates. TCGs, on the other hand, focus on the opportunity to extract rare, high-value cards. The combination of the two works because:
Surprise is the product: Winning a rare card can obviously strongly stimulate dopamine secretion;
Community + onlooker effect: unboxing videos, unpacking live broadcasts, social media showing-off culture;
Financialization: the card pack/box itself becomes a tradable asset (sealed Pokémon boxes, Pop Mart boxes).
2, PokémonCardson-chainTokenization
FocusCourtyard (Polygon),Collector's Crypt(Solana),Phygitals(Solana) andEmporium(Solana) platforms. Monthly trading volume for the card tokenization sector reached a historical peak of approximately $114.5 million in August 2025, a 6.2x increase from January 2025. This data covers four leading platforms: Courtyard (Polygon), Collector Crypt, Phygitals, and Emporium (the latter three are all based on Solana). This data demonstrates how these platforms generate sustained liquidity through compounding network effects (inventory depth × user base). The data clearly shows that the Gacha mechanism is the dominant driving force (accounting for approximately 90-99% of the total transaction volume on the four major platforms), which accurately reveals the actual source of the majority of revenue (card pack profits, transaction fees and buyback income), rather than secondary market peer-to-peer transactions. Gacha spending increased approximately 490% from approximately $10.4 million (January) to approximately $61.1 million (August). Consistent with the recent boom in traditional card game platforms, these on-chain platforms have achieved product-market fit. More notably, user spending growth has surpassed market transaction volume, indicating a positive user acceptance of the repurchase/claim cycle. In terms of market share, Courtyard maintained its leading position, but Collector Crypt's share rose sharply from about 9.8% (January) to about 36.5% (August); Courtyard accounted for about 61.4%; Phygitals accounted for about 2%; and Emporium accounted for about 0.1%.
3、GachaUser Consumption Habits and Financial Status
Analysis of Revenue Contribution and Consumption Distribution of Users at Each Level and Total Revenue
(1)Courtyard
![]()
(2)Collector Crypt
(3)Phygitals
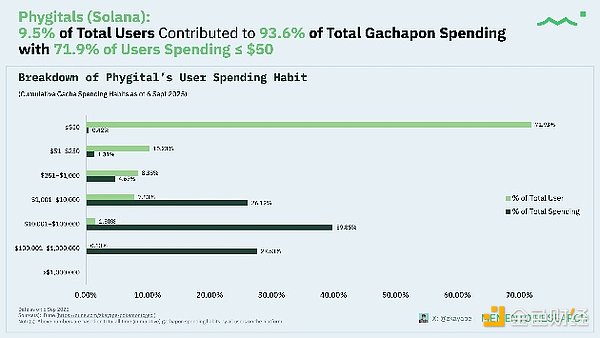
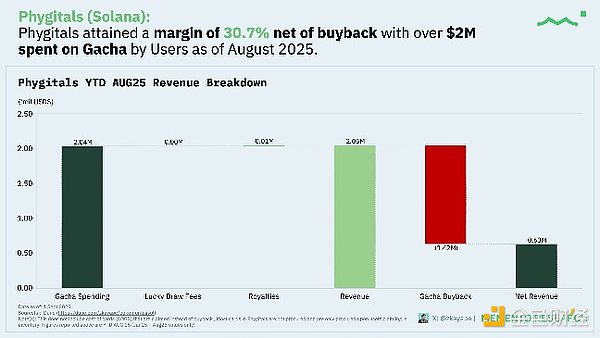
(4)Emporium
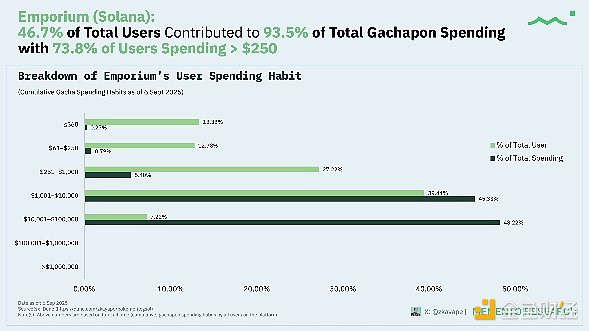
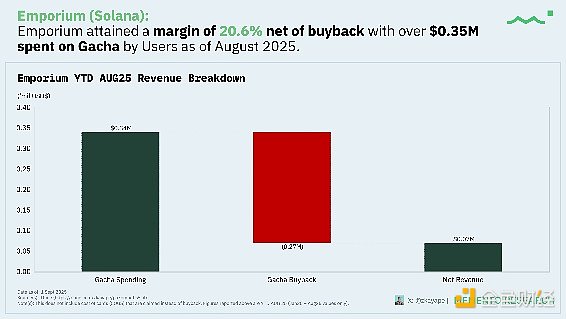
 Anais
Anais


