"Take a break and wait for the Fed's decision before taking action." These days, there's been a wait-and-see mood among the investment community. The Federal Reserve will announce its latest interest rate decision at 2:00 AM Beijing time on September 18th. This is the fifth rate cut since last September. The market expects another 25 basis point cut, from the current 4.5% to 4.25%. This time a year ago, everyone was waiting for the start of the rate cut cycle. Now, we're halfway there. Why is everyone waiting for the decision? Because history shows that when the Fed begins its rate cuts, various asset classes often see a surge in market activity. So, with this rate cut, where will Bitcoin go? How will the stock market and gold perform? Looking back at the Fed's rate-cutting cycles over the past 30 years, perhaps we can find answers from historical data. Which rate-cutting cycle are we at? Historically, Fed rate cuts have never been simple. Sometimes, rate cuts are a shot in the arm for the economy, triggering a surge in the market. But other times, rate cuts can be the prelude to a storm, signaling a greater crisis to come, and asset prices may not necessarily rise accordingly. In 1995, a precautionary interest rate cut was implemented. Then-Federal Reserve Chairman Alan Greenspan faced a "happy dilemma": solid economic growth, but signs of overheating. So he opted for a "precautionary rate cut," lowering the interest rate from 6% to 5.25%, a total reduction of just 75 basis points. The result? The US stock market ushered in the most glorious five-year bull market of the dot-com era, with the Nasdaq Composite Index quintupling in the following five years. It was a textbook soft landing. In 2007, a bailout-style interest rate cut occurred. As depicted in the film "The Big Short," the subprime mortgage crisis was already emerging, but few realized the scale of the storm. That September, when the Federal Reserve began cutting interest rates from 5.25%, the market was still celebrating, and the S&P 500 had just hit a record high. But everyone knows what happened next: Lehman Brothers collapsed, a global financial crisis unfolded, and the Federal Reserve was forced to cut interest rates from 5.25% to 0.25%—a 500 basis point reduction—in just 15 months. This belated rescue still failed to prevent the economy from sliding into the worst recession since the Great Depression. In 2020, panic-stricken interest rate cuts were common. The unforeseen "black swan" COVID-19 pandemic struck. The Federal Reserve implemented two emergency rate cuts on March 3rd and 15th, dropping it from 1.75% to 0.25% in just 10 days. Simultaneously, it initiated "unlimited quantitative easing," swelling its balance sheet from $4 trillion to $9 trillion. This unprecedented level of monetary easing created one of the most bizarre moments in financial history: the real economy ground to a halt, while financial assets thrived. Bitcoin rose from $3,800 in March 2020 to $69,000 in November 2021, an increase of more than 17 times.
Looking back at these three interest rate cut models, you can also see three asset changes with similar results but different processes:
Preventive interest rate cut:
A small interest rate cut, a soft landing of the economy, and a steady rise in assets
Bailout interest rate cut:
A large interest rate cut, a hard landing of the economy, and a first fall and then a rise in assets
The Crypto Market's Interest Rate Cut Scenario
This time, when the Fed opens the tap again, what will happen to the crypto market?
To answer this question, we need to first understand what the crypto market experienced during the last round of interest rate cuts.
From 2019 to 2020, when a market with a market capitalization of only $200 billion suddenly ushered in trillions of liquidity, the entire asset price rise process did not happen overnight. The 2019 Interest Rate Cut Cycle: Much Ado, Little Action On July 31 of that year, the Federal Reserve cut interest rates for the first time in a decade. This should have been a major boon for the crypto market at the time. Interestingly, Bitcoin seemed to have gotten the message early. At the end of June, Bitcoin began its rally from $9,000, reaching $13,000 by mid-July. The market was betting that the rate cut would usher in a new bull market. But when the rate cut actually came, the market's performance was surprising. On July 31st, the day of the rate cut, Bitcoin fluctuated around $12,000 before subsequently declining. In August, it fell below $10,000, and by December, it had retreated to around $7,000. Why did this happen? Looking back, there are likely several reasons. First, the 75 basis point rate cut was relatively modest, releasing limited liquidity. Second, the crypto market had just emerged from the 2018 bear market, and investor confidence was low. Most importantly, traditional institutions were still on the sidelines, and the funds from this round of rate cuts primarily flowed into the stock market, with the S&P 500 rising nearly 10% during the same period.

In the first week of March, the market already sensed a crisis. On March 3rd, the Federal Reserve implemented an emergency rate cut of 50 basis points. Bitcoin not only failed to rise, but actually plummeted from $8,800 to $8,400. The market logic was: emergency rate cut = major economic problems = run first.
The following week was the crypto market's darkest hour. On March 12th, Bitcoin plummeted from $8,000 to $3,800, a drop of over 50% in 24 hours. Ethereum suffered even worse, falling from $240 to $90. The classic "3.12" tragedy has become a collective traumatic memory for the crypto market. This day's plunge was actually part of a global liquidity crisis. Panic over the pandemic triggered a sell-off of all assets—stock market circuit breakers, falling gold prices, and even U.S. Treasury bonds. Investors frantically sold everything for cash, even "digital gold" Bitcoin. Even more devastatingly, the high leverage in the crypto market exacerbated the decline. On derivatives exchanges like BitMEX, numerous long positions with 100x leverage were liquidated, resulting in a cascading liquidation process like an avalanche. Within a few hours, the total amount of liquidated funds across the entire network exceeded $3 billion. But just when everyone thought the market was about to fall to zero, a turning point occurred. On March 15, the Federal Reserve announced an interest rate cut to 0-0.25% and launched $700 billion in quantitative easing (QE). On March 23, the Fed even launched the "unlimited QE" strategy. After Bitcoin bottomed out at $3,800, it embarked on an epic rally: March 13, 2020: $3,800 (low) May 2020: $10,000 (up 160% in 2 months) October 2020: $13,000 (up 240% in 7 months) December 2020: $29,000 (up 9 months) 660% increase)
April 2021: $64,000 (up 1580% in 13 months)
November 2021: $69,000 (up 1715% in 20 months)
It's not just Bitcoin; the entire crypto market is celebrating. Ethereum soared from $90 to a high of $4,800, a 53-fold increase. Many DeFi tokens saw increases of over a hundredfold. The total market capitalization of the crypto market swelled from $150 billion in March 2020 to $3 trillion in November 2021. Comparing 2019 and 2020, why did the market react so differently to both rate cuts? Looking back, the answer is simple: the magnitude of the rate cut determines the scale of capital inflows. In 2020, the rate was cut directly to zero, coupled with unlimited quantitative easing (QE), effectively opening the floodgates. The Federal Reserve's balance sheet expanded from $4 trillion to $9 trillion, suddenly creating an additional $5 trillion in liquidity. Even if only 1% of that flowed into the crypto market, that would still be $50 billion. This represents one-third of the total crypto market capitalization at the beginning of 2020. Furthermore, 2020 also saw a shift in investor sentiment from extreme panic to extreme greed. In March, everyone was selling everything for cash, and by the end of the year, everyone was borrowing money to buy assets. This volatile mood amplified price fluctuations. More importantly, institutions also entered the market. MicroStrategy began buying Bitcoin in August 2020, acquiring over 100,000 coins. Tesla announced a $1.5 billion Bitcoin purchase in February 2021. Grayscale Bitcoin Trust (GBTC) holdings grew from 200,000 coins at the beginning of 2020 to 650,000 by the end of the year.
The purchases by these institutions not only brought in real money, but more importantly, brought an endorsement effect.
Judging from the extent of the interest rate cut, the market expected a 25 basis point cut on September 17th, and this is just the beginning. If current economic data is extrapolated, the entire interest rate cut cycle (over the next 12-18 months) could result in a cumulative 100-150 basis points of cuts, ultimately bringing the rate to around 3.0-3.5%. This range falls between the 75 basis points in 2019 and the zero rate in 2020. From a market perspective, Bitcoin is already near its all-time high of $115,000, unlike in March 2020, where it has significant room for further growth. However, unlike in 2019, when the market was freshly emerging from a bear market, market confidence remains relatively high. From the perspective of institutional participation, the approval of a Bitcoin ETF marks a watershed moment. In 2020, institutions were tentative buyers, but now they have standardized investment tools. However, institutions have also become smarter and will not follow the FOMO-driven buying spree of 2020-2021. Perhaps, in 2024-2025, we will see a third scenario: neither the flatness of 2019 nor the frenzy of 2020, but rather a kind of "rational exuberance." Bitcoin may not see another 17-fold increase, but a steady rise as liquidity opens is a more compelling logic. The key also lies in the performance of other assets. If both the stock market and gold are rising, funds will be diverted.
The performance of traditional assets during interest rate cuts
Interest rate cuts not only affect the crypto market, but the performance of traditional assets is also worth paying attention to.
For crypto investors, understanding the historical performance patterns of these assets is crucial, as they are both a source of funding and a competitor.
U.S. stocks: Not all interest rate cuts can bring about a bull market
According to BMO's research data, we can see the detailed performance of the S&P 500 in the interest rate cut cycle over the past 40 years:
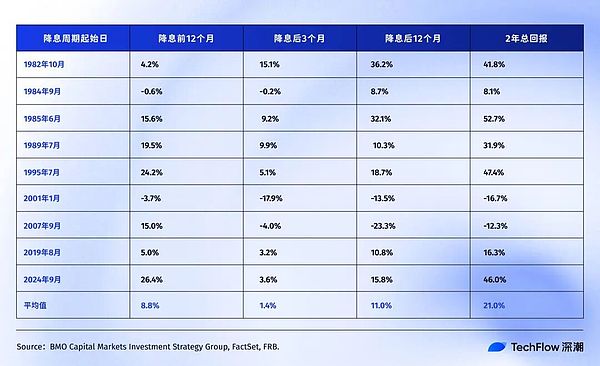
History shows that
the S&P 500 indexisin the first
of the Federal Reserve
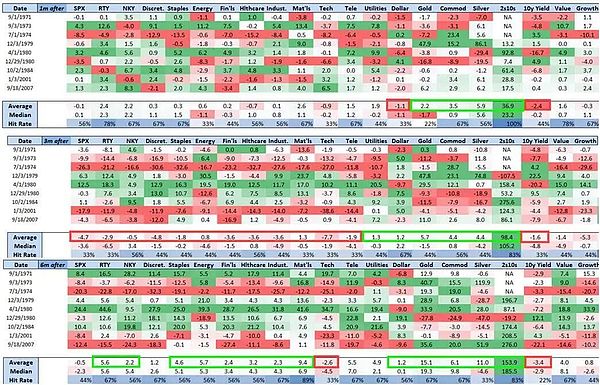
In addition, according to research by Nomura Securities, three months after the 50 basis point rate cut, the S&P 500 was basically unchanged, but the Russell 2000 index of small-cap stocks rose an average of 5.6%. This makes sense. Small companies are more sensitive to interest rates, their borrowing costs are higher, and rate cuts would provide a greater marginal improvement. Furthermore, small-cap stocks often represent "risk appetite," and when they begin to outperform the broader market, it signals a shift in market sentiment toward optimism.
Back to now, since the interest rate cut in September 2024:
S&P 500: From 5,600 points to 6,500 points (+16%)
Nasdaq: From 17,000 points to 22,000 points (+30%)
Compared with historical data, the current 16% The annualized increase has already exceeded the 11% average following each Fed rate cut. More importantly, the Nasdaq's gain is nearly double that of the S&P 500. The S&P 500 was already at a historical high before the rate cut, a rarity in previous rate-cutting cycles. Bond Market: The Most Robust, But Also the Most Boring Bonds are the most reliable asset class during rate-cutting cycles. When the Fed cuts rates, bond yields fall and bond prices rise, almost without surprise.
According to Bondsavvy's analysis, the decline in 10-year Treasury yields in different interest rate cut cycles is quite stable:
2001-2003: Down 129 basis points
2007-2008: Down 170 basis points
2019-2020: Down 261 basis points (special period of the epidemic)
![]()
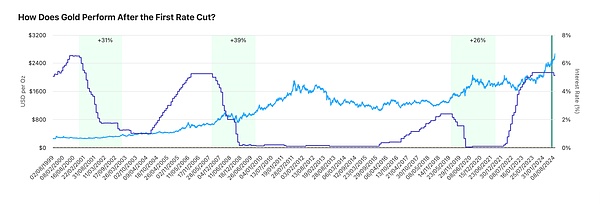
According to Auronum's research, gold's performance in the last three interest rate cut cycles is as follows:
2001 interest rate cut cycle: rose 31% within 24 months
2007 interest rate cut cycle: rose 39% within 24 months
2019 interest rate cut cycle: rose 26% within 24 months


 Alex
Alex


