Author: Marie Poteriaieva, CoinTelegraph; Compiler: Tao Zhu, Golden Finance
Abstract
It is well known that predicting the top of the Bitcoin market cycle is very difficult, but combining technical indicators and behavioral indicators can provide strong signals.
MVRV-Z score, Pi cycle top indicator, volume trend, Puell multiple and exchange inflow can accurately predict the top of the Bitcoin price cycle.
BTC may be approaching the final stage of its current market cycle - first a sharp rebound, followed by a sharp correction and finally entering a bear market. For many, this may be the long-awaited climax of the past four years, and major players are also preparing for it.
Since the end of 2024, the amount of Bitcoin whales holding coins has surged. Glassnode data shows that the number of addresses holding more than 100 BTC jumped nearly 14% to 18,200, the highest level since 2017. The largest market players appear to be positioning themselves for the final upswing of this cycle.
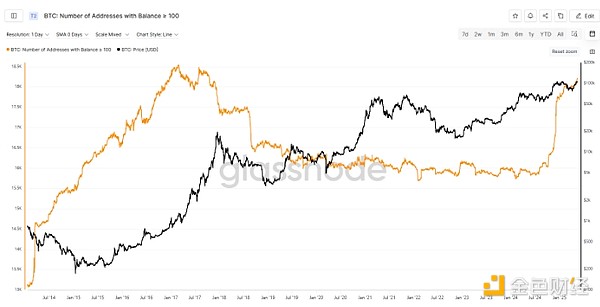
Number of BTC addresses holding more than 100 BTC. Source: Glassnode
However, riding the wave is much harder than imagined, and knowing when to exit is notoriously difficult. The lure of higher price highs can fuel fear of missing out (FOMO), driving investors to buy at highs only to face painful losses or even liquidation.
So how can traders and investors spot a top before the market enters a recession?
Bitcoin Cycle Top Markers
Several technical and on-chain indicators, such as the MVRV (market value to realized value) Z-score, Pi Cycle Tops, and volume trends, have historically been able to reliably predict when Bitcoin is nearing a peak.
The MVRV-Z-score compares Bitcoin's market value to its realized value and adjusts for volatility. A high Z-score indicates that Bitcoin is significantly overvalued relative to its historical cost basis. When this indicator is at an all-time high, Bitcoin prices are likely to fall.
The Pi Cycle Top tracks BTC price dynamics using moving averages. When the 111-day simple moving average (111-SMA) crosses above twice the 350-day moving average (350-SMAx2), it signals an overheated market. In other words, a market top is formed when the short-term trend catches up with the long-term trajectory.
Historically, all previous Bitcoin bull runs started with a significant surge in the MVRV Z-score and ended with the 111-SMA crossing the long-term trendline.
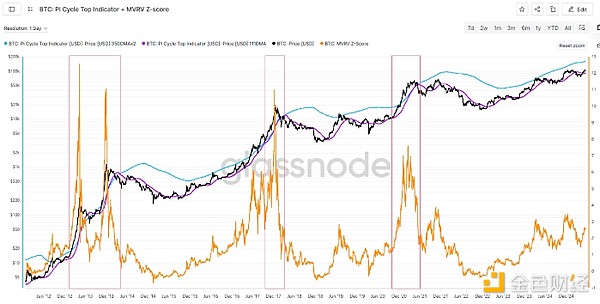
BTC: Pi Cycle Top + MVRV Z-score. Source: Marie Poteriaieva, Glassnode
In addition, a decline in volume during a price rally can be a warning sign, often signaling weakening momentum and the possibility of a reversal. On Balance Volume (OBV), which records cumulative volume, is an important indicator for tracking this progress. When OBV diverges from price action, it often signals an early reversal.
The second phase of the 2021 bull run is a great example. While BTC prices hit a high of $68,000 (compared to the previous all-time high of $63,170), volume moved in the opposite direction, falling from 710,000 BTC to 628,000 BTC. This created a bearish divergence between price and volume, indicating that fewer market participants were supporting the rally—a classic sign of fading momentum.
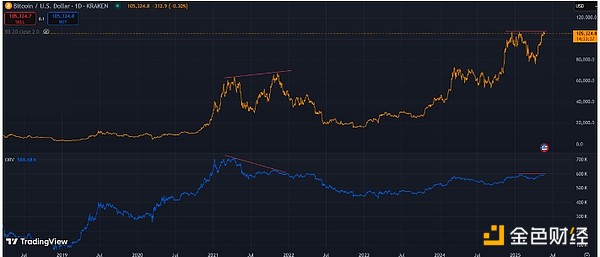
BTC/USD 1-day OBV. Source: Marie Poteriaieva, TradingView
Profit-taking indicators
As market cycles top out, long-term holders and Bitcoin miners typically start locking in profits. Some valuable indicators to track this are the Puell Multiple and exchange traffic.
The Puell Multiple measures how much miners are earning relative to their 365-day average. High readings indicate that miners may begin to sell aggressively, and usually occur near market tops.
Large inflows to exchanges are often a sign that investors are preparing to sell their crypto.
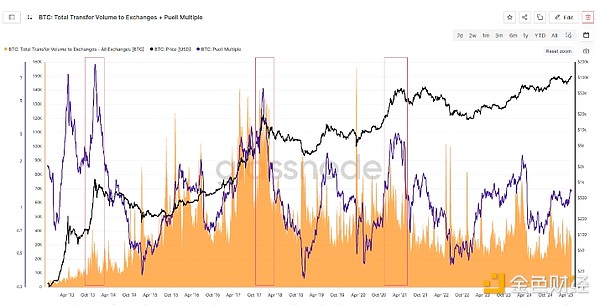
Total BTC volume transferred into exchanges + Puell Multiple. Source: Marie Poteriaieva, Glassnode
Individually, these indicators can mark various changes in market trend. Combined, they often coincide with cycle tops.
15% Rule
Historical price activity observations may also come in handy. Crypto market analyst Cole Garner shared his exit strategy based on whale behavior. His roadmap consists of three steps:
Up. Bitcoin has been in vertical swings for weeks, with a sharp rise above $10,000 on the daily candlestick chart.
Shock. Bitcoin has experienced the most violent pullback in its bull cycle. The curved parabolic trendline that supported the rebound was broken - a clear sign that the price may have topped. Meanwhile, the price of altcoins and meme tokens may continue to rise for a while.
Complacency. The price is 15% below Bitcoin's all-time high. This is the sell zone. The order books of major exchanges usually show a large number of sell orders around this level - this may be an exit point for institutional investors.
According to Garner, the 15% (or 16%) rule applies not only to the cryptocurrency market, but also to traditional markets.
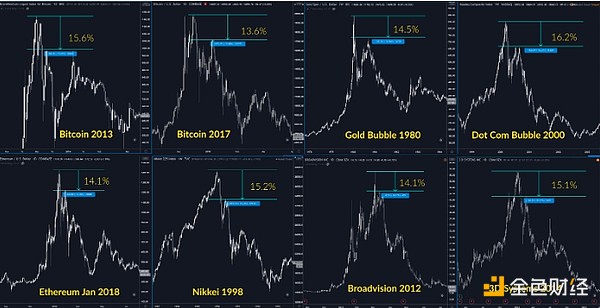
Historical top performers: BTC, ETH, Gold, Nasdaq, Nikkei, Broadvision, 3D Systems. Source: Cole Garner
No single indicator can accurately predict when to exit, especially in a rapidly changing macro environment. But when multiple signals converge, they are hard to ignore. The final stages of the Bitcoin bull run are exciting, but knowing when it ends is key to locking in profits.
 Miyuki


