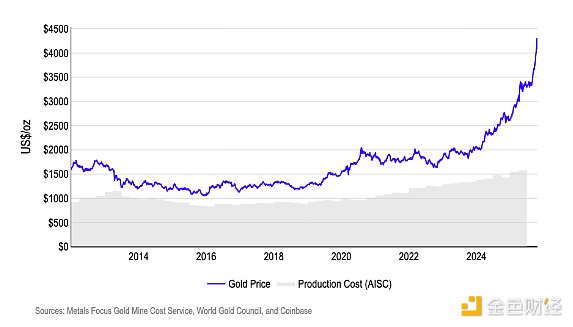
Source: Coinbase; Compiled by Golden Finance. After reaching a new high of $4,300 per ounce, gold prices experienced one of their sharpest corrections in years last week, falling by approximately 5-6% at one point or for two consecutive trading days before stabilizing—a classic example of "overbought" behavior in a momentum-driven market. Nevertheless, the surge in gold prices over the past few months may be impacting gold's supply and demand dynamics by making it more cost-effective to expand gold mining. At current prices, gold mining offers very high operating margins, and while the economics of Bitcoin mining appear favorable for efficient operators, significant variation remains across the industry. Gold's all-in sustaining costs (AISC) are concentrated around $1,000 per ounce, while spot prices fluctuate around $4,000. Despite recent market volatility, there remains significant room for upside (Figure 1). For reference, AISC covers most production costs—on-site mining/processing, royalties and production taxes, sustaining G&A expenses, reclamation costs, and sustaining capital items—but excludes items such as income taxes, financing costs, and merger-related or other one-time adjustments.
Figure 1. Gold prices diverge significantly from production costs
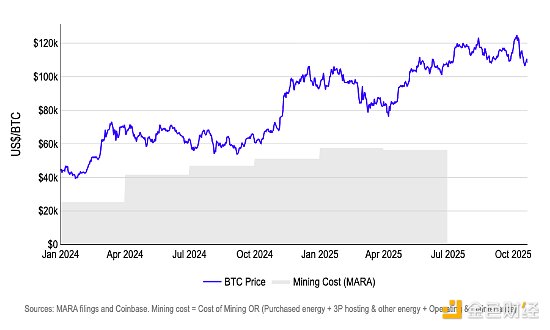
For Bitcoin, proxy data using disclosures from large publicly traded miners (Marathon/MARA) shows that mining costs are well below the current Bitcoin spot price, supporting healthy operating margins. However, we caution that miners' cost structures vary widely—actual costs fluctuate depending on mining machine efficiency, power contracts, colocation, depreciation/capital expenditures, and scale, meaning that low-cost operators may appear to have high margins while high-cost operators have much lower margins (Figure 2).
Figure 2. BTC Price vs. MARA Mining Costs
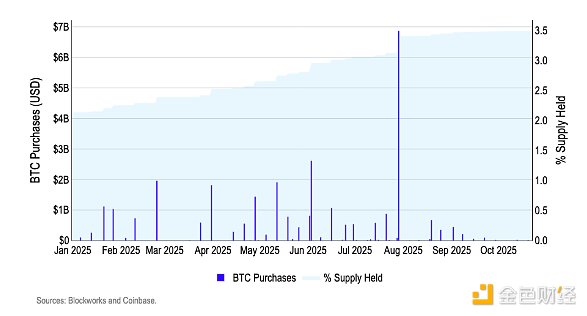
Unit economics highlight this asymmetry: at current prices, gold's margins are structurally higher, while Bitcoin's margins are more volatile, squeezed by mining difficulty, fees, and volatility flows. With gold spot prices trading thousands of dollars above all-in sustaining costs, most producers have strong operating cash flow—even during pullbacks. We argue that Bitcoin miners are far more exposed to risk cycles. When Bitcoin prices rise and fees surge, hashrates rise, cushioning operators. But when prices stagnate and mining difficulty rises, profit margins tighten, and marginal sellers re-emerge. We argue that Bitcoin and gold have very different cost-to-supply dynamics: gold's curve is more resilient to external factors, while Bitcoin's issuance is fixed. Rising gold prices tend to (1) widen profit margins, (2) attract brownfield expansion and new capital expenditures, and over time (3) increase production, although lead times and fixed input costs (diesel, labor, ongoing capital expenditures) push the lower bound on all-in sustaining costs (AISC) higher over time. However, Bitcoin's protocol maintains issuance at around 450 BTC/day, regardless of price (Figure 3). Figure 3. BTC vs. Gold New Supply Due to relatively slow (gold) or inelastic (bitcoin) supply growth, we believe pricing in 2025 will be dominated by fund flows. We believe gold, the decisive winner of the "depreciation trade," has experienced a parabolic rise: cumulative ETF inflows surged in 2025, and the total share of "central bank + investment" rose toward a cycle high—a clear positive driver of currency depreciation hedging (Figure 4). In cryptocurrencies, US spot Bitcoin ETFs currently capture a significant share of marginal demand, with cumulative inflows still growing in 2025, despite continued daily price volatility. Figure 4. BTC vs. Gold ETF Net Inflows We believe that demand-driven growth is the decisive lever for both assets to rise in 2025. For gold, central banks remain net buyers, while investors re-engage through ETFs and spot holdings, increasing their share of total gold demand from 32% in Q1 2021 to 60% in Q2 2025 (Figure 5). Meanwhile, for Bitcoin, demand from spot ETFs and digital asset treasuries (DATs) has attracted billions of dollars, with these institutions now holding a significant share of the circulating supply (Figure 6).
Figure 5. Gold demand breakdown
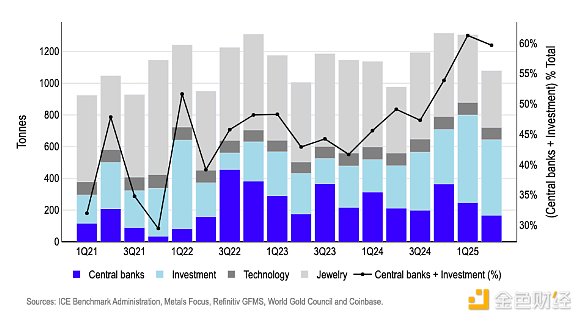
Figure 6. DAT currently accounts for 3.5% of BTC supply
Our view: While mining costs set price floors and pressure points, speculative flows dominate price discovery for both gold and Bitcoin. Currently, gold's AISC is well below the spot price, providing a stable foundation for its value—especially in 2025, when prices have already risen due to excess demand from central banks and investors. For Bitcoin, fixed emissions mean that mining costs do not constrain supply in the same way. Instead, pressure emerges when mining difficulty and energy costs rise and speculative demand weakens. Strong inflows through spot ETFs and DATs support Bitcoin prices and ease pressure on miners' balance sheets; while weak inflows and rising difficulty could compress profit margins and prompt miners to sell. Gold's cost curve is slowly rising in a range around $1,000 per ounce. Meanwhile, Bitcoin's supply growth is mechanically attenuated, but different miner cost ranges mark areas of intensified pressure, and price increases are more reflective of macro liquidity and broader risk conditions. In summary: The economics of gold and Bitcoin production provide a price foundation, but performance in 2025 will be primarily driven by demand flows driven by a favorable macro backdrop, including growing global liquidity and a weaker US dollar. What about DATs? BTC Digital Asset Treasury (DAT) companies largely stayed on the sidelines during the post-October 10th decline and have yet to re-engage. Over the past two weeks, DAT BTC buying volume has fallen to near year-to-date lows, with no significant recovery even on price rebounds (Figure 7). We believe this absence is significant, as BTC DATs are typically the largest and most flexible entities—they have the ability to intervene when market confidence is high. Their nearly two-week absence, even at current discounts, suggests limited market confidence, in our view. Figure 7. DAT Buying Volume Over the Past 7 Days. Since the October 11th drop, the only consistent buyer has been ETH, and this buying has been concentrated in a single DAT. ETH DAT's total 7-day buying volume remains positive, but attribution analysis shows that a single entity (Bitmine or BMNR) has driven the majority of net buying, with smaller contributions from other funds (Figure 8). If BMNR buying slows or pauses, we worry that the apparent corporate buying could fade.
Figure 8. ETH Holdings – Share by DAT
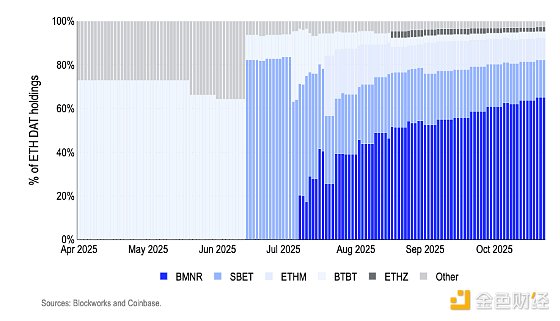
Our View: DAT buying has yet to emerge in BTC and is concentrated solely in ETH, highlighting that large investors remain cautious after leverage has been breached, even at current "support" levels. We believe this warrants more cautious positioning in the short term, as the market appears more vulnerable when large investors' balance sheets are stranded.
 Davin
Davin


