Written by Rick Maeda. Compiled by TechFlow
On the surface, the much-anticipated halving in the Bitcoin network has historically been bullish.
However, given the number of halvings that have occurred in history, and taking a closer look at BTC's performance in the context of the overall market, it is difficult to make any highly definitive judgments based solely on the halving event itself.
Overall, the Bitcoin halving may not be a tradable event, but it is structurally bullish from a supply perspective. With the right macro tailwind, BTC could rise again after the halving.
Main text
The consensus about the Bitcoin halving is that it is bullish, and the general belief is that it is a tradable event. But is this really the case? In this article, we delve into past halving events and look at supply and macro data for the upcoming 2024 halving to gain a deeper understanding of what this pre-announced event means for investors.
What is Bitcoin Halving?
A halving is a pre-programmed event in the Bitcoin network that cuts the reward for Bitcoin miners in half (see below for more on what this means). It is an important mechanism in Bitcoin's monetary policy, ensuring that only 21 million BTC will ever be in circulation, as well as preventing inflation because it reduces the rate at which new BTC are created.
This pre-programmed update occurs every 210,000 blocks, which roughly translates to once every four years, with the next estimated to be April 20, 2024. When Bitcoin was launched in 2009, the mining reward was set at 50 BTC, and after three halvings (2012, 2016, and 2020), the reward will soon drop to 3.125 BTC per block.
Bitcoin uses a Proof-of-Work (PoW) consensus mechanism to verify and secure transactions on the blockchain. In PoW, miners compete to solve complex math problems, and the first miner to solve the problem correctly will get to add the next block of transactions to the blockchain. For verifying transactions and adding blocks to the blockchain, the winning miner will receive newly created Bitcoins as a reward, and this reward is "cut in half" in a halving.
The Reality of Historical Halvings
On the surface, the halving has proven to be very bullish for BTC.
Figure 1 below shows the historical price action of BTC before and after each previous halving day, from one year before to one year after. The red dashed line shows the volume-weighted average of past halvings, while the black line shows the current BTC path.
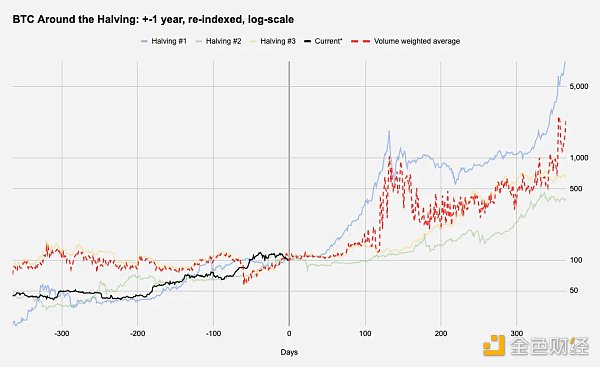
Figure 2 below shows the performance of Bitcoin halving in a table. Since the upcoming halving is scheduled for April 20, 24, we extrapolate the prices in recent days by using the latest price data from April 17, 24. The log-scale y-axis of Figure 1 suggests that the halving is a bullish catalyst, but given that we only have three observations, with the first one when BTC was just $12.80 and the third occurring in May 2020 when all risk assets were trading sharply higher in the Covid rally, any interpretation of the data needs to be treated with caution. Furthermore, when we look at the average 1-year return of BTC since mid-2011, with the exception of the first halving in 2012, the returns 1 year after the halving do not look impressive. Here, the 2020 halving raises an interesting question about how global markets are performing overall. In Figure 3 below, we replicate Figure 2, using equities, specifically the S&P 500, as a benchmark for risk assets: The SPX’s 1-year rolling average return is +11.42% (since mid-July 2011, consistent with the historical BTC price data we have), while its 1-year average performance since the Bitcoin halving is over +27%, or more than double the average! This highlights an important reality that the popular narrative is often happy to ignore. Just as we wouldn't conclude "So the program update in the Bitcoin network that cut the reward miners receive in half is very bullish for the S&P 500," we probably can't draw true conclusions from Bitcoin's past performance. Otherwise, by some measure like the hit ratio to outperform the average, you could even conclude that the Bitcoin halving is more bullish for the SPX than it is for Bitcoin itself!
For those interested in volatility, there is no obvious relationship to the halving date or period. Figure 4 examines realized volatility 30 days before and after the halving date: 2024 Halving Theme 1: Long-term Holders Here we look at the total amount of BTC held by long term holders, adjusted for BTC’s supply. Given that BTC’s circulating supply will increase before the hard-coded 21 million Bitcoin cap is reached, we divide the amount held by long term holders by the circulating supply at that time to look at the percentage of holdings: Although less pronounced in 2020, Figure 5 suggests that long term holders may take profits ahead of the halving, with a decline also seen in 2024. This selling dynamic is often attributed to miners; since the halving essentially reduces revenue per block by 50%, miners often sell a portion of their reserves when rewards decrease in order to upgrade their hardware to mine more efficiently when rewards decrease. Since we are only days away from the 2024 halving, this structural selling pressure may be occurring right now. 2: Exchange BTC Balances While exchanges don’t make directional bets, we still look at whether exchanges’ reserve holdings (and by extension, potentially their internal market makers) show any patterns around the halving date: There is nothing interesting to be seen in Figure 6 related to the halving. The only observable trend is a longer term one, with exchange balances experiencing a ~6 year accumulation period, with balances steadily declining since the start of the previous bull run. 3: Macro Background The relevance of macro conditions to Bitcoin is often debated, but macro cycles, especially USD liquidity (as a function of monetary policy/interest rates, risk appetite, etc.) remain the driving force of asset prices in the medium to long term. With this in mind, we focus on what the market is pricing in for the Fed Funds rate over the next 12 months on the halving day.
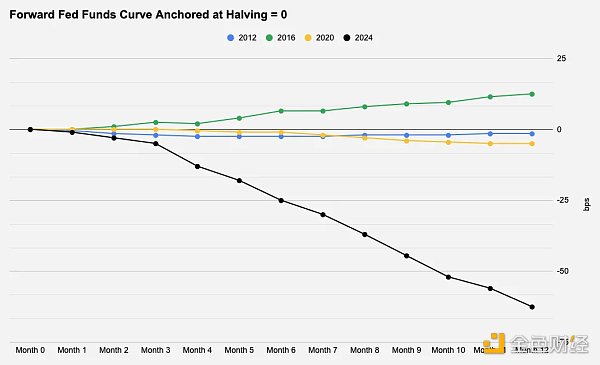
It is clear that the upcoming 2024 halving is an outlier, with almost 3 rate cuts expected.
Lower interest rates are generally bullish for risk assets, but for price action, what often matters is not the rate that is priced in, but the magnitude of the deviation from market expectations, whether it is inflation data or statements from the Fed Chairman. In Figure 8, we compare the actual settlement implied rate to market expectations for each halving date to see how accurate the forward pricing in Figure 7 is. The 2012 and 2020 data are fairly ordinary, within 10 basis points of the initially expected range, but 2016 is worth studying because the Fed raised rates twice, which was not yet priced in at the time of the second halving. Interestingly, Figures 1 and 2 show that the 12 months following the 2016 halving was BTC’s worst performance of the three prior halvings, and the only time it performed below its 1-year average return. So with more than two rate adjustments today for the next 12 months, a more important driver for BTC post-halving could be continued inflation in the US, or anything else that might encourage the Fed to stay put rather than cut rates.
Conclusion
We briefly explored the unique macro context for the upcoming halving, but there are other considerations not covered in this report, primarily around the recent spot BTC ETF launch. Given all the attention BTC has been getting lately, this is definitely the most anticipated halving to date, and the general institutionalization of BTC introduces new players that could change the dynamics of supply, demand, and price action. It’s worth noting here that the newly launched ETF holds over 4.1% of BTC’s circulating supply, while MicroStrategy owns over 1%. Given there have only been three halvings before, drawing statistically significant conclusions from past performance to determine if this is a tradable event is difficult. But structurally, this is undoubtedly a bullish event from a supply perspective.


 JinseFinance

