Author: Yashu Gola, CoinTelegraph; Compiled by: Deng Tong, Golden Finance
Since February 12, Ethereum’s native cryptocurrency Ethereum has increased by more than 20% relative to Bitcoin. This notable surge is largely due to expectations of the possible approval of a spot Ethereum exchange-traded fund (ETF) in the United States in May this year.
However, the widely watched ETH/BTC cryptocurrency pair has reached a historical inflection point that could increase its risk of a correction in the coming days. Let’s explore these issues in detail below.
Bearish Fractal Gains on Ethereum
It is worth noting that the 4-hour ETH/BTC chart below It shows that Ethereum is hovering near the 1.00 Fibonacci retracement level at 0.06044 BTC. Additionally, its relative strength index (RSI) reading has turned “overbought” after breaking above 70, indicating a correction.
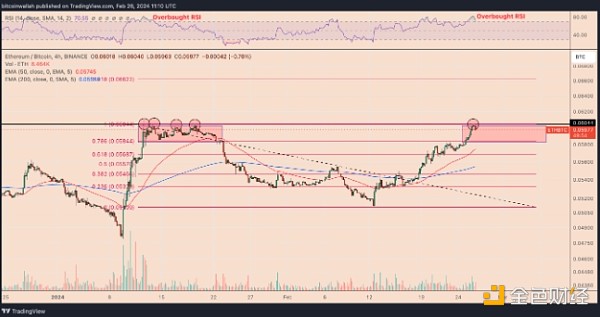
ETH/BTC 4-hour price chart. Source: TradingView
The combination of these two technical data is very similar to the fractal seen in January 2024 before the ETH/BTC trading pair dropped 11.65%.
Specifically,an overbought RSI combined with historical resistance increases the likelihood of investor buying fatigue. This scenario could cause Ethereum’s value to fall relative to Bitcoin, first towards the 0.786 Fibonacci line at 0.058 BTC.
Rising wedge pattern appears
However, the rising wedge pattern is awaiting bearish confirmation. existence, there is the possibility of further depressing the ETH/BTC trading pair, targeting a 10.85% decline from the current position to the level of 0.053 BTC by March.
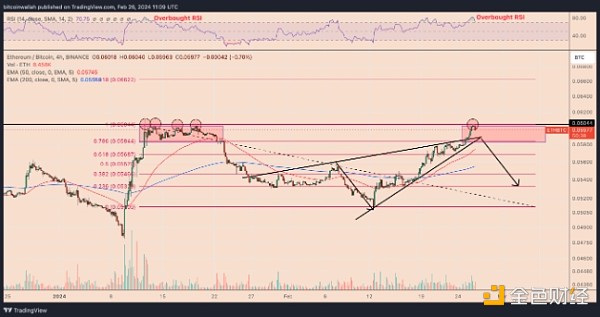
ETH/USD four-hour price chart, rising wedge breakout. Source: TradingView
The rising wedge is often considered a bearish reversal indicator, indicating a shift in momentum from up to down.
ETH/BTC forms a descending triangle on the weekly chart
On the weekly time frame chart, Ethereum is showing signs of a bearish reversal as it struggles to close above multi-year descending trendline resistance. Interestingly, this trendline coincides with the 50-week exponential moving average (50-week EMA; red wave) for ETH/BTC.
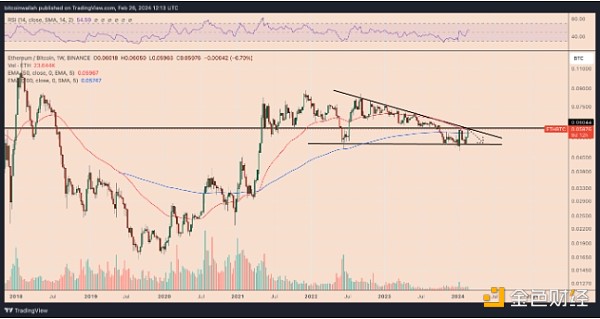
ETH/BTC weekly price chart. Source: TradingView
This confluence of resistance could limit Ethereum’s upside attempts in the coming weeks, making it easier for the cryptocurrency to pull back to 0.051 BTC, a level seen in June 2022 and a sharp rebound between October 2023 and January 2024.
Ethereum whale holdings decline
Major investors (often referred to as "whales") There are also significant differences between the Ethereum and Bitcoin portfolios.
For example, the number of entities holding 1,000-100,000 ETH dropped significantly in February, according to Glassnode data.
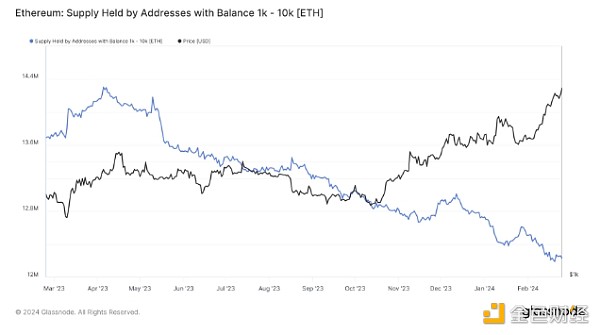
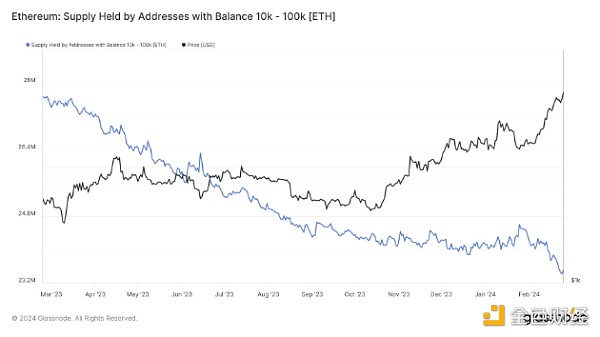
Ethereum supply is held by addresses with balances between 1000-100000 ETH. Source: Glassnode
The number of Bitcoin entities holding more than 1,000 BTC has increased, a trend attributed to a surge in capital inflows from recently launched ETFs.
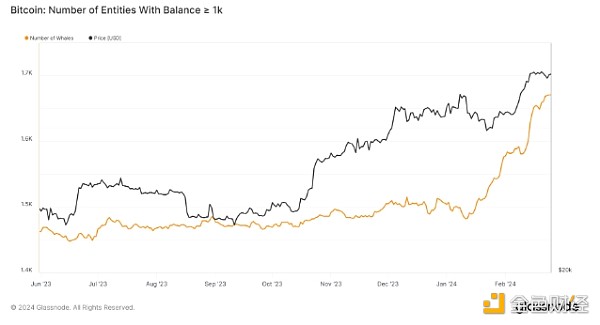
The number of Bitcoin entities holding more than 1,000 BTC. Source: Glassnode
This essentially means that institutional investors are more interested in Bitcoin than Ethereum, reinforcing the bearish case for ETH/BTC in addition to technical factors.
 Beincrypto
 Beincrypto
 Bitcoinist
 Bitcoinist
 Cointelegraph
 Cointelegraph
 Bitcoinist
 Cointelegraph
 Bitcoinist
 Cointelegraph
 Cointelegraph