While U.S. financial markets remained in holiday mode on Monday due to the Independence Day holiday, Bitcoin (BTC) kicked off a new week.
Bitcoin has fallen below the $20,000 mark, continues to feel pressure from the macro environment, and discussions that Bitcoin has not yet bottomed are still everywhere.
After the weekend, position holders found themselves stuck in a tight range, with the chances of a breakout to the upside looking increasingly slim.
A trader and analyst pointed to July 4 as a "crazy downside" day for the cryptocurrency market, with bitcoin counting down to weather the Federal Reserve's latest rate hike.
What else will happen next week? Cointelegraph will be watching for factors that could affect the market in the coming days.
Bitcoin price is biding its time
Bitcoin managed to trade unscathed over the weekend, but the typical pitfalls of off-peak trading remain in place.
U.S. stocks won't resume trading until July 5, providing ample opportunity for some typical weekend price action.
So far, Bitcoin market volatility has generally stabilized - except for a brief drop to $18,800, BTC/USD has been hovering between $19,000 and $19,500 for a few days.
Data from Cointelegraph Markets Pro and TradingView shows that even the weekly close didn’t bring about a real trend change, with the psychological $20,000 mark remaining intact.
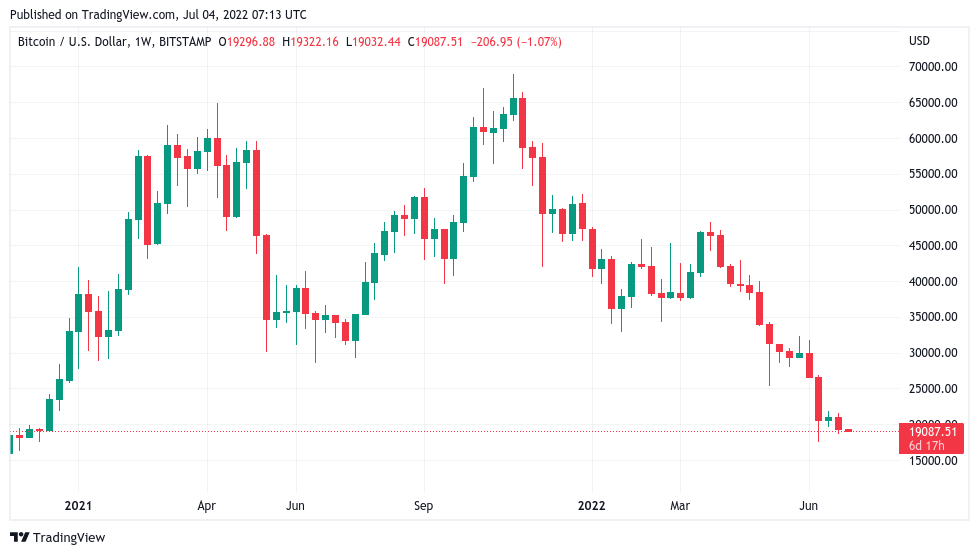 BTC/USD 1-week candlestick chart (Bitstamp). Source: TradingView
Popular trading account Crypto Tony reiterated to Twitter followers in its latest July 4th update: “While below the bottom range, we expect a drop to $18,000.”
Other traders continue to focus on the region around $16,000 for a possible downside range for Bitcoin.
At the same time, with no significant Bitcoin futures spreads in Asian markets and lackluster performance, short-term traders have little chance of achieving their short-term price targets.
Meanwhile, the U.S. dollar continued to hold near 20-year highs after a strong pullback in the previous session.
At the time of writing, the U.S. dollar index (DXY) is above 105.
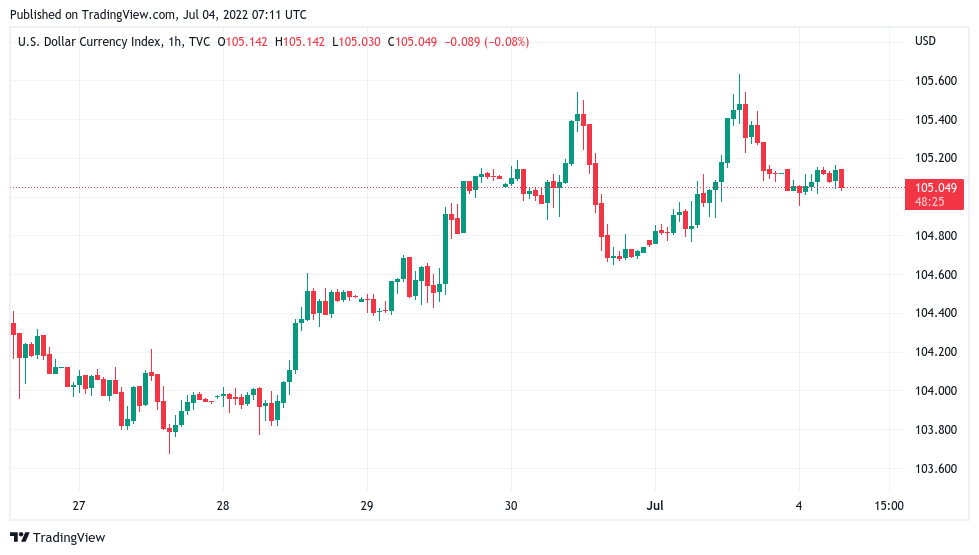 US Dollar Index (DXY) 1-hour candlestick chart. Source: TradingView
Gold nears 'takeoff' against US stocks
U.S. stocks could take a break on Monday, with Wall Street closed for the Independence Day holiday. However, one popular chartist focused on gold's strength against stocks in the current environment.
On Twitter that day, gold monitoring expert Patrick Karim pointed out that gold is about to touch the historical "blast off" area relative to the S&P 500 index.
After bottoming out at the end of 2021, the ratio of gold to the S&P 500 has recovered this year and is now on the verge of crossing boundaries that have historically caused gold prices to rise sharply.
"Gold is approaching 'takeoff zone' relative to US equities. Previous takeoffs have unleashed significant gains for silver and mining companies," Karim commented.
In dollar terms, the situation is different. A stronger dollar has kept XAU/USD (gold spot against the U.S. dollar) below $2,000 since March.
Still, for silver lovers, this means that even a mild pass on the XAU/SPX ratio could lead to solid returns.
This prediction once again calls into question Bitcoin’s ability to break out of macro trends. Due to the continued correlation with stocks, a breakout of gold against Bitcoin would be a natural knock-on effect if Karim's vision comes to fruition.
Prominent trader and analyst CRYPTOBIRB concluded over the weekend: “After breaking out of a sideways pattern that had been in place for 1.5 years, the correlation with the S&P 500 has risen sharply to 86%.”
"Right now, the ratio of 0.78 remains strongly positive."
Another analyst, Venturefounder, pointed out that Bitcoin is also closely correlated with the movement of Nasdaq.
Cointelegraph also reported that Bitcoin’s inverse correlation to the U.S. dollar is currently at a 17-month high.
Arthur Hayes Says Bitcoin Will Take a 'Crazy Downward Journey'
With the stock market closed on Monday, bitcoin price action has hovered on the edge of support, and Arthur Hayes, former CEO of derivatives platform BitMEX, sees this long weekend as a long day of reckoning for the encryption market.
His reasoning seemed logical. The Federal Reserve raised its key interest rate by 75 basis points in late June, providing fertile ground for an adverse reaction by risk assets. Low-liquidity "after-hours" holiday trading increases the likelihood of price swings to the upside or downside. Hayes warned last month that the two "cocktails" together could be powerful.
"By June 30th (the end of the second quarter), the Fed will implement a 75 basis point rate hike and start shrinking its balance sheet. July 4th is Monday, a federal and bank holiday," he blogged wrote:
"It's another perfect trap for a massive sell-off in cryptocurrencies."
So far, though, signs of what Hayes called a "crazy downside" haven't materialized. BTC/USD has remained virtually unchanged since late last week.
The deadline should be Tuesday, July 5th, when traders and funds come back to provide the liquidity needed to stabilize the market and pick up any cheap tokens on last-minute dips.
Hayes added that his previous predictions of a bottom of $27,000 for BTC/USD and $1,800 for ETH/USD had “shattered” in June.
Mining difficulty is still rising
Despite considerable concerns about miners’ ability to withstand the current BTC price drop, the fundamentals of the Bitcoin network remain calm.
Impressively, miners are determined to stay on the network, with the difficulty showing no signs of lowering in this week’s upcoming adjustment.
After a small 2.35% drop two weeks ago, there will be little change in mining difficulty this time around. Mining difficulty will automatically rise and fall according to the fluctuation of miners' participation.
According to the on-chain monitoring resource BTC.com, if the current price of Bitcoin remains unchanged, the mining difficulty will even increase by 0.5% on the basis of still being close to the historical high.
 An overview of Bitcoin network fundamentals (screenshot). Source: BTC.com
As for the miners themselves, it is believed that the ones who are being forced out are less efficient players - possibly new players with a higher cost base.
Meanwhile, data uploaded on social media last week by Charles Edwards, chief executive of asset management firm Capriole, puts miners’ overall production costs at around $26,000. $16,000 of this is electricity, which means miners’ daily expenses directly affect their ability to control losses in the current environment.
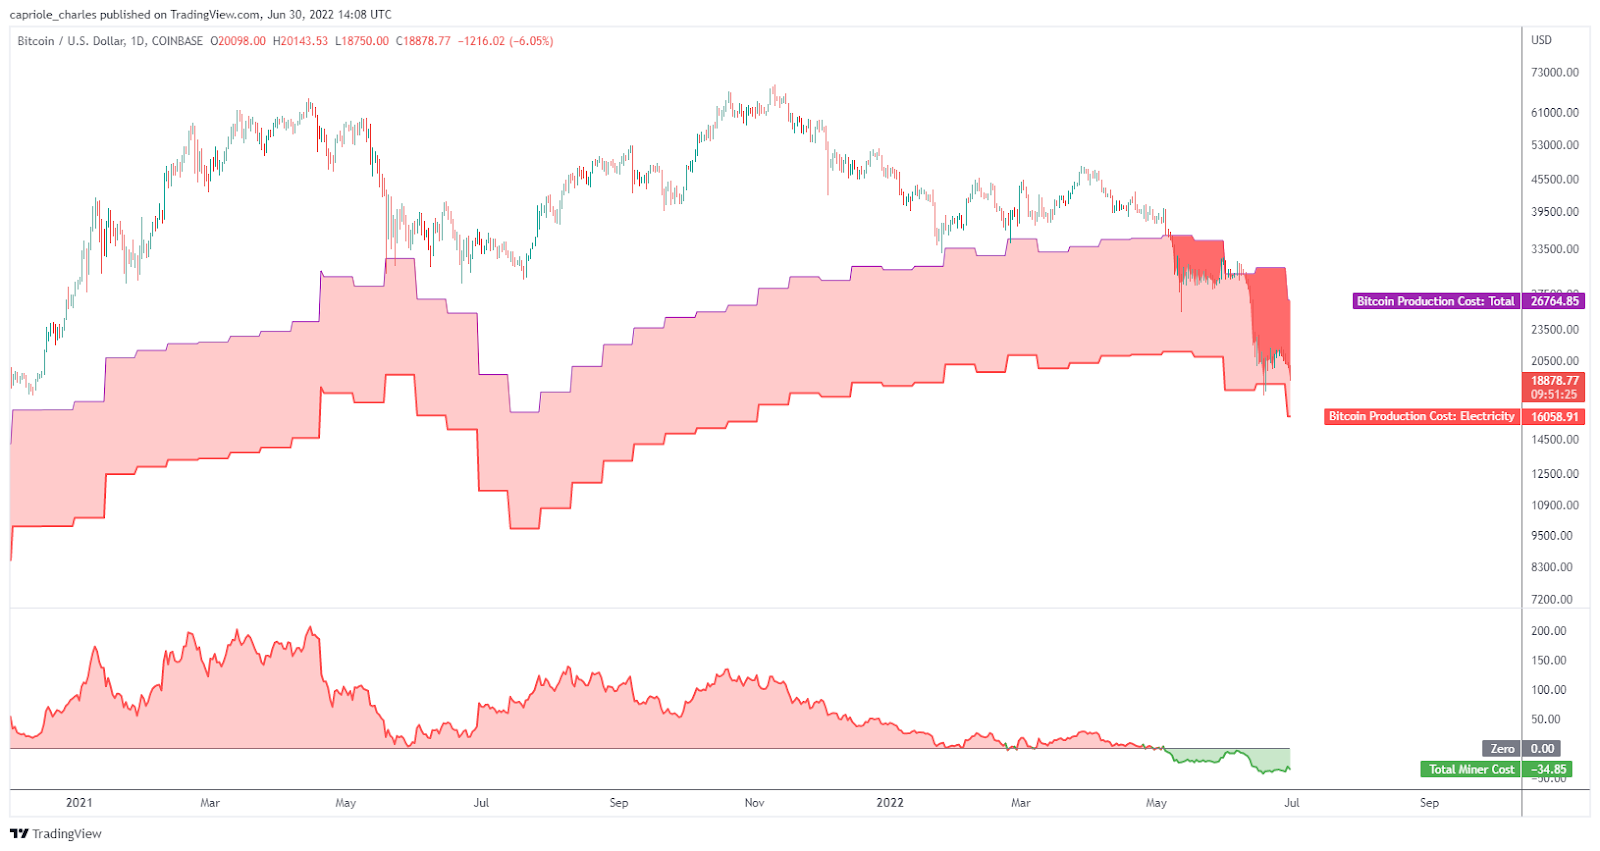 Bitcoin miner production cost chart. Source: Charles Edwards / Twitter
lows across the board
Record oversold prices are nothing new this year, especially in recent weeks, according to on-chain data from Bitcoin.
This trend continued in July as the Bitcoin market returned to a scene not seen since the March 2020 cross-market crash.
According to data from on-chain analytics firm Glassnode, the number of bitcoins now at a loss is the highest since July 2020. Glassnode analyzed the weekly moving average of unspent transaction outputs (UTXOs) in losses.
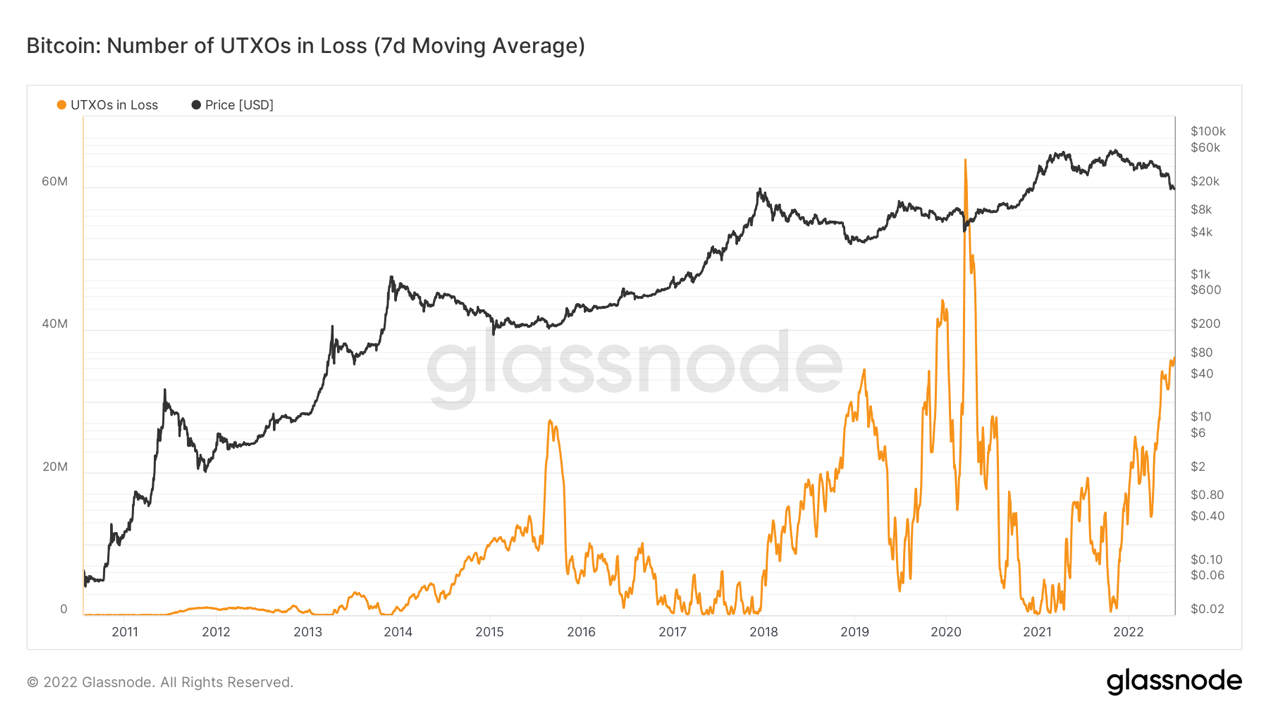
Bitcoin loss UTXO chart (7-day moving average). Source: Glassnode
Similarly, UTXO profit ratio hit a two-year low on July 3, at just over 72%.
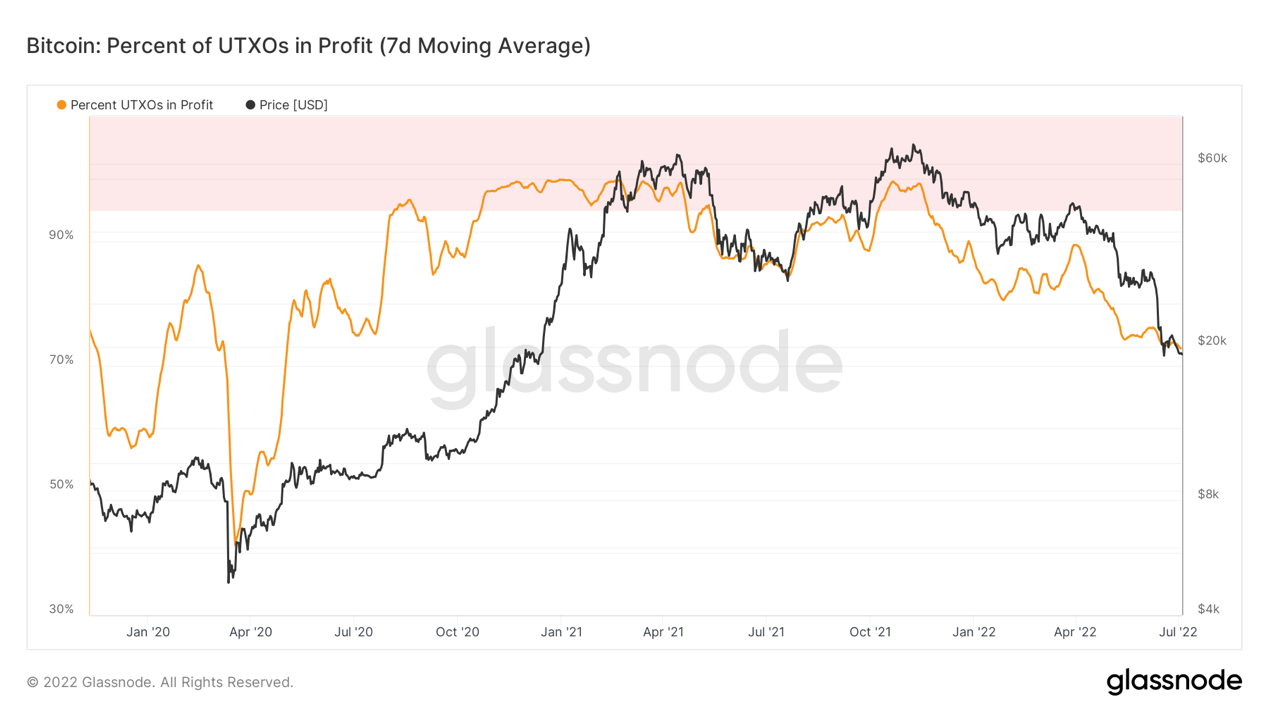 Bitcoin UTXO profit ratio (7-day moving average). Source: Glassnode
Rare as it may be, a bear market may offer some hope. Bitcoin transaction fees, once painfully high during the network's active bull market, are now at their lowest level since July 2020. Glassnode shows that the average transaction fee is $1.15.

Median Bitcoin transaction fee graph. Source: Glassnode
Cointelegraph reported that the same goes for Ethereum network gas fees.
 Jixu
Jixu


