Source: Liu Jiaolian
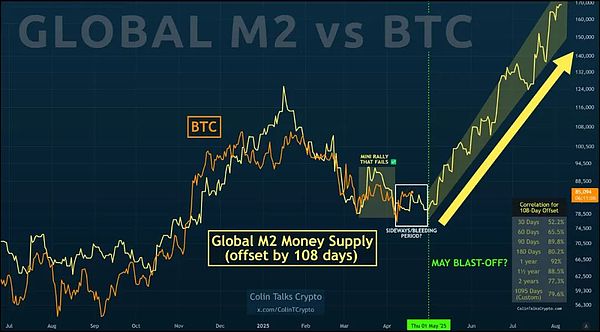
BTC rose above 87k on Monday. The following picture is a chart about the correlation between global money supply (M2) and BTC price, which Jiaolian has mentioned many times in previous internal references. The figure shows that after 108 days, the global macro liquidity (M2 money supply) is quite consistent with the trend of BTC. What kind of logic is hidden behind this intriguing synchronicity?
The core logic of the model is how global macro liquidity is transmitted to BTC.
The global M2 indicator is equivalent to the total amount of money printed by central banks of various countries, and it reflects the level of funds in the market. When the central bank prints a large amount of money (such as the global flood of money after the epidemic in 2020), these new currencies will not immediately flow into the BTC market. The 108-day lag period set in the chart attempts to capture the time difference in the transmission of funds from the central bank's "flooding" to the inflow into the crypto market.
The data show that as the statistical period lengthens, the correlation between the two increases significantly: the correlation coefficient for 30 days is only 52%, while the correlation for a 3-year period reaches 79.6%. This shows that the correlation between BTC price and monetary easing is not an immediate reaction, but a resonance of medium- and long-term trends. When market liquidity continues to be loose, some funds will gradually penetrate into high-risk assets such as BTC, but this process requires steps such as restoring investor confidence and establishing capital flow paths.
When the yellow arrow on the right side of the chart points to "possible breakthrough", the implied logic is: if the current global M2 continues to expand (such as the Bank of Japan continues to ease and the Federal Reserve suspends interest rate hikes), according to the 108-day transmission cycle, BTC may usher in a new round of capital-driven rise in May 2025.
However, the model also reveals obvious limitations. The failure of a small rebound in early 2023 shows that money supply alone cannot fully explain short-term fluctuations. At that time, although global M2 was still growing, the US banking crisis caused funds to temporarily flow into traditional safe-haven assets. As an emerging asset, BTC instead suffered a liquidity siphon effect. This reminds us that macro liquidity is only a necessary condition, not a sufficient condition, to affect currency prices.
It is obvious that the current size of the crypto market is still too small compared to the size of global liquid assets.
BTC plays a contradictory role in the transmission chain of macro liquidity to the crypto market. On the one hand, its constant total amount means that it is regarded by some investors as an anti-inflation tool. When expectations of fiat currency depreciation increase, funds may flow in at an accelerated rate. On the other hand, it is still a high-risk asset. When there is a liquidity crisis in the market (such as the early stage of the epidemic in March 2020), investors will give priority to selling BTC in exchange for US dollar cash, causing it to fall in tandem with risky assets.
This dual attribute causes the relationship between BTC and M2 to present nonlinear characteristics. The 79.6% correlation data in the past three years in the figure has actually undergone multiple "divergence-regression" fluctuation tests. For example, when the mining industry was cleared out in 2021, the policy shock briefly interrupted the transmission effect of monetary easing, but when the market digested the negative news, prices returned to the M2 curve. This shows that the underlying logic of the model is resilient, but the specific transmission process will be affected by exogenous variables such as geopolitics and regulatory policies.
For ordinary investors, the value of this model lies not in predicting specific rises and falls, but in establishing a macro cognitive framework. When we observe that major economies collectively turn to easing (such as interest rate cuts and quantitative easing), it can be regarded as a background signal for BTC's medium- and long-term improvement; and when global central banks tighten monetary policy, we need to be wary of the pressure brought about by the retreat of liquidity. The high correlation of 1095 days (about 3 years) in the figure suggests that observing from a cyclical perspective of more than 3 years may be more valuable than chasing short-term fluctuations.
At the same time, we must be wary of equating correlation with causation. The price of BTC is also affected by multiple factors such as the halving cycle, on-chain technology evolution, and institutional participation. For example, the BTC halving event in 2024 may have a double boost effect due to the global M2 growth, but it may also have an offsetting effect due to changes in regulatory policies. Therefore, this model is more suitable as one of the puzzle pieces for analyzing the market rather than the only basis for decision-making.
By extending our thinking from this chart, we may be able to see more clearly the position of BTC in the contemporary financial system: it is both a product of global currency over-issuance and a challenger to the traditional financial order. The 108-day lag effect essentially reveals the efficiency and resistance of funds migrating from traditional markets to the crypto world. When mainstream financial institutions begin to include BTC in their asset allocation, this transmission cycle may be further shortened; and when a black swan event occurs, the lag period may be passively extended. Understanding this dynamic balance may be more valuable than simply focusing on price increases and decreases.


 Catherine


