After Bitcoin hit an all-time high of $73,000, selling pressure has significantly eased as a large number of long-term holders began to reallocate their Bitcoin assets.
Currently, Bitcoin prices continue to consolidate not far below their historical peaks, and long-term investors have begun to accumulate Bitcoin assets again for the first time since December 2023. At the same time, as the first batch of Ethereum spot ETFs were historically approved for listing in the United States, Ethereum prices rose by 20% accordingly.
Summary
Although the prices of Bitcoin and Ethereum have been consolidating in small fluctuations since March, the markets of these two assets have shown relative strength after a long period of consolidation after experiencing historical price peaks.
The SEC's approval of an Ethereum spot ETF surprised the market, causing ETH prices to rise by more than 20%.
The net flow of Bitcoin spot ETFs in the United States turned positive again after four weeks of net outflows, indicating that demand from the traditional financial sector has rebounded.
The selling pressure from long-term holders has dropped significantly, while investor behavior has returned to an asset accumulation mode, indicating that the market needs higher volatility to drive the next wave.
Poised for a rebound
After experiencing the lowest point of Bitcoin's price drop since the FTX crash (-20.3%), the price of Bitcoin began to recover to its historical peak and reached $71,000 on May 20. Compared to previous situations, the pattern of price retracements in the 2023-24 uptrend seems to be very similar to the retracements seen in the 2015-17 bull run.
The 2015-17 uptrend occurred during the early stages of Bitcoin, when there were no derivatives available to analyze the asset class. But now we can compare it with the current market structure, and the analysis shows that the 2023-24 uptrend may be mainly driven by the spot market. The launch of US spot ETFs and fund inflows just support this assertion.
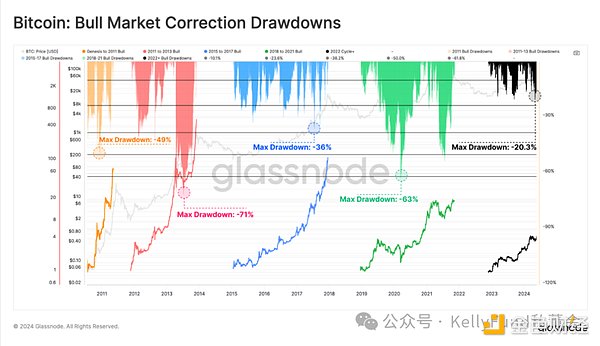
Figure 1: Bitcoin bull market correction retracement
Since the low point generated by the FTX crash, Ethereum's adjustment has been significantly smaller compared to previous cycles. This market structure suggests that market resilience is being strengthened to some extent between each successive pullback, while downside volatility is also being reduced.
However, it is worth highlighting that Ethereum has been slower to recover relative to Bitcoin. ETH has significantly underperformed compared to other top crypto assets over the past two years, which is mainly reflected in the relatively weaker ETH/BTC ratio.
Nevertheless, the approval of an Ethereum spot ETF in the United States is a broadly unexpected development that may provide the necessary catalyst to stimulate a stronger ETH/BTC ratio.
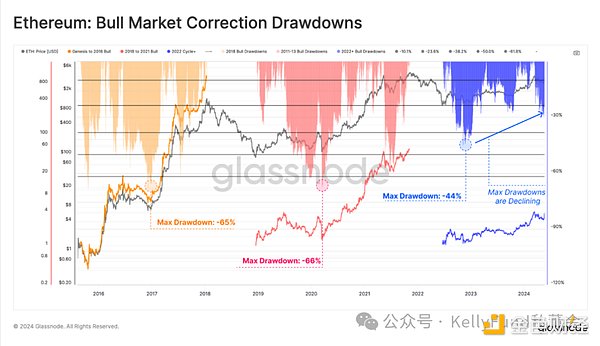
Figure 2: Ethereum bull market adjustment retracement
If we consider the rolling performance of the Bitcoin market in weekly, monthly and quarterly time frames, we can see that the overall performance is strong, with gains of 3.3%, 7.4% and 25.6% respectively.
To highlight those periods of particularly strong price performance, we can calculate the number of trading days with an upward performance of more than 20% in all three time scales within a 90-day window. So far, only 5 days have reached this threshold in the last quarter.
In previous cycles, this value was generally between 18 and 26, indicating that the current market may be more cautious relative to historical bull markets.
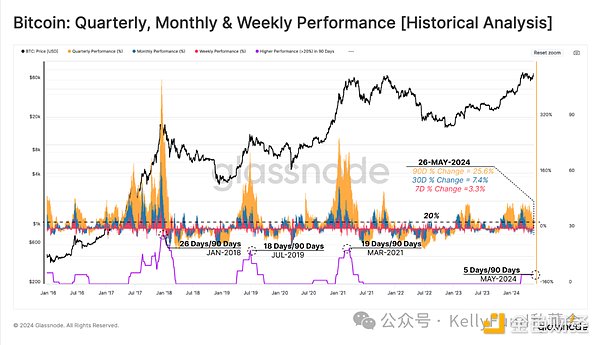
Figure 3: Bitcoin quarterly, monthly and weekly market performance (historical analysis)
We can evaluate Ethereum in a similar framework and see the huge impact of the approval of the Ethereum ETF - the news almost immediately triggered buy-side pressure, which led to the first price changes of more than 20% since the end of 2021 in all three time scales.
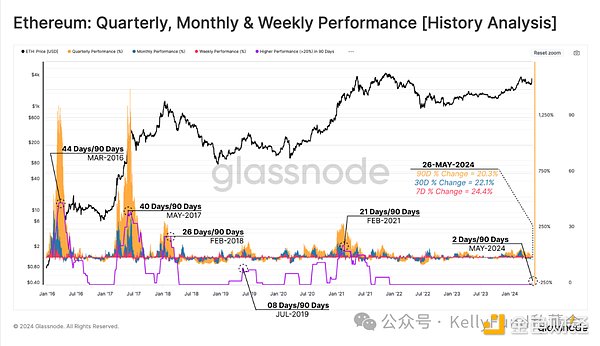
Figure 4: Ethereum quarterly, monthly and weekly market performance (historical analysis)
ETF buyers return
In early March, the price of Bitcoin broke through a new high of $73,000, and at the same time, supply from long-term holders was pouring into the market as they sold heavily. This seller situation created an oversupply, which led to a period of price correction and consolidation. Over time, the lower Bitcoin price and sellers' investment potential caused by this situation began to give way to a new market trend of reaccumulating assets.
We can see this in the flow of funds to Bitcoin ETFs, which turned into a net outflow throughout April. As the market sell-off drove the price of Bitcoin down to local lows around $57,500, the ETF saw massive net outflows of up to $148 million per day. However, this proved to be only a short-term collapse in confidence, and the market trend has since reversed sharply.
In the penultimate week of May, the Bitcoin ETF experienced massive net inflows of $242 million per day, indicating the return of buy-side demand. Considering the natural selling pressure exerted by miners since the halving of Bitcoin is $32 million per day, the buying pressure on the ETF has almost surged 8 times. This highlights the huge scale and volume of the impact of the Bitcoin ETF, but also shows that the halving event has a relatively small impact.
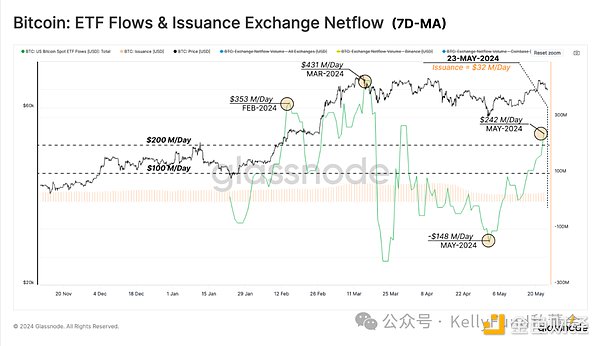
Figure 5: Bitcoin ETF flow & net inflow of issuing trading platforms (7-day moving average)
Return to the euphoria stage
The percentage of circulating supply in profit provides valuable information for each market cycle, as well as a set of recurring patterns. In the early stages of a bull market, when prices attempt to return to previous historical peaks, the percentage of supply in profit will break through the statistical threshold of around 90%. The breakthrough of this statistical threshold marks the beginning of the pre-euphoria stage of the market, which historically attracts investors to take profits from the table.
In this case, the selling pressure generated by the market usually comes from long-term holders - at this stage, they will seize the opportunity to sell assets at high prices and seek to take profits, especially after enduring the downward volatility of the entire bear market. Their impulse to sell assets at this stage is particularly obvious.
As new price discovery is completed and Bitcoin prices break through new historical peaks, the market begins to enter the euphoria stage, and the profit supply begins to fluctuate around the 90% level in the next 6-12 months. The current market is still in the early stage of the euphoria stage, but it has also been active for about 2.5 months. As of this writing, 93.4% of the Bitcoin assets in the market supply are in profit.
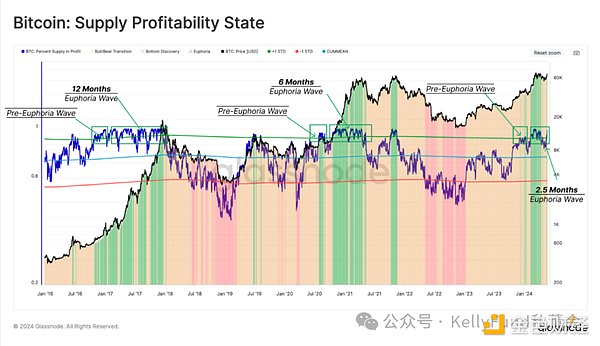
Figure 6: Bitcoin supply profit status
Another tool we can use to monitor corrections is the size of unrealized losses held by investors. Given that unrealized losses near historical peaks in price represent "local head buyers", we can assess the proportion of supply assets that fall into a 90-day rolling window of losses. The purpose is to assess the percentage of Bitcoin assets that have turned from profit to loss compared to the local price peak.
Mechanically, these deep declines occur as new capital enters the Bitcoin network, which absorbs the buying pressure caused by investors reallocating their assets during the local uptrend, and this new capital then falls into losses in the subsequent price correction.
The depth of the retracement in the current uptrend is also similar to that of the 2015-2017 bull run, which once again proves that the market is still relatively strong. This also shows that although Bitcoin's local price peak has been refreshed again, investors do not seem to have bought too many Bitcoin assets at too high a price.
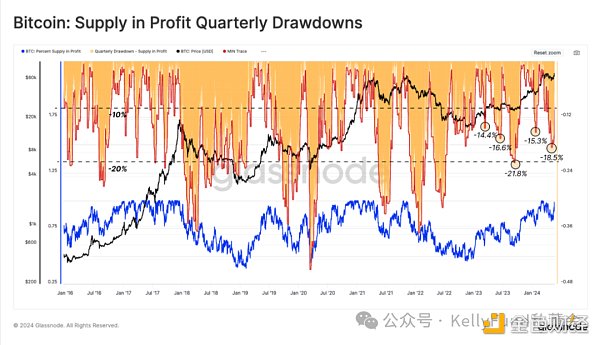
Figure 7: Bitcoin supply profit quarterly retracement
"Diamond Hand" dominates the market
As prices rise due to new buying pressure, the importance of selling pressure from long-term holders also grows. Therefore, we can measure the reasons that are sufficient to stimulate them to sell assets by evaluating the unrealized profits of the long-term holder group, and evaluate the actual situation of the sellers through their realized profits.
First, the MVRV ratio of long-term holders reflects the multiple of their average unrealized profits. Historically, the trading profits of long-term holders in the transition stage between bear and bull markets are above 1.5 but below 3.5, and this stage can last for one to two years.
If the market's upward trend continues and eventually forms a new historical price peak in the process, the unrealized profits of long-term holders will expand. This will greatly increase their desire to sell and eventually lead to a certain degree of seller pressure, which will gradually exhaust the demand that appears in the market.
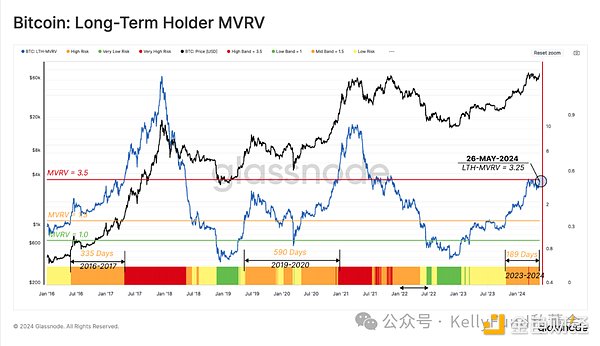
Figure 8: Bitcoin long-term holders MVRV
As a summary of this analysis, we will evaluate the spending rate of long-term holders through the 30-day net position change in the supply from long-term holders. In March, when Bitcoin was moving towards a new historical peak, the market experienced the first major asset allocation from long-term holders.
In the past two bull markets, the net allocation rate of long-term holders reached 836,000 to 971,000 Bitcoins/month. Currently, the net selling pressure from them peaked at 519,000 Bitcoins/month at the end of March, of which about 20% came from Grayscale ETF holders.
After this "squandering" state, the market ushered in a cooling-off period, with local accumulation of assets leading to a monthly increase in the total supply from long-term holders of about 12,000 bitcoins.
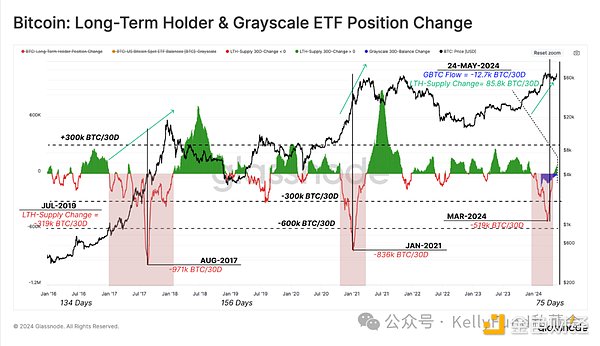
Figure 9: Changes in ETF holdings of long-term holders and Grayscale
Summary
After the Bitcoin price hit a record high of $73,000, as a large number of long-term holders began to reallocate their Bitcoin assets, the selling pressure was significantly reduced. Subsequently, long-term holders began to accumulate Bitcoin again for the first time since December 2023. In addition, the market demand for spot Bitcoin ETFs has also rebounded significantly, which has led to positive capital inflows in the market and reflects huge buyer pressure.
In addition, with the SEC's approval of the US Ethereum spot ETF, the competitive environment between Bitcoin and Ethereum has become evenly matched. This allows digital assets to further deepen their presence in the entire traditional financial system and is also an important step forward for the industry.
 JinseFinance


