Author: Liu Jiaolian
Star bridge magpies, only seen after years, miss the love and hate of parting. Cowherd and Weaver Girl, don't be separated. It's sunny, rainy, and windy.
No matter how the market changes, the hoarders only have BTC (Bitcoin) in their hearts. The 4.15 article "Win x5" the day before yesterday said that it is now the tail end of the wyckoff accumulation mode. Last night, the 4.16 Jiaolian internal reference "Bull Market Early Big Wash" mentioned that some research institutions believe that it is currently a wash in the early stage of the bull market, which also coincides with the judgment of the 4.15 Jiaolian internal reference "Hong Kong Approves BTC and ETH Spot ETFs".
The late investment master Munger once said that to see how high a person's IQ is, you have to see whether he can accommodate two completely opposite views in his mind and still act calmly. We should also pay attention to keep an open mind and allow any beneficial and reasonable opposing views to enter our sight and mind. Netizen Stockmoney Lizards has put forward some different insights on the current market situation.
At present, from a macro perspective, people are busy with the opposite bull and bear factors: three wars, zero? BTC production is halved, sky-high? New high, start a bull market? The US economy is in a good situation, continue to raise interest rates, zero? ... It is really a world of ice and fire.
The netizen’s view is that BTC is currently moving out of a wyckoff top distribution mode. See the figure below:
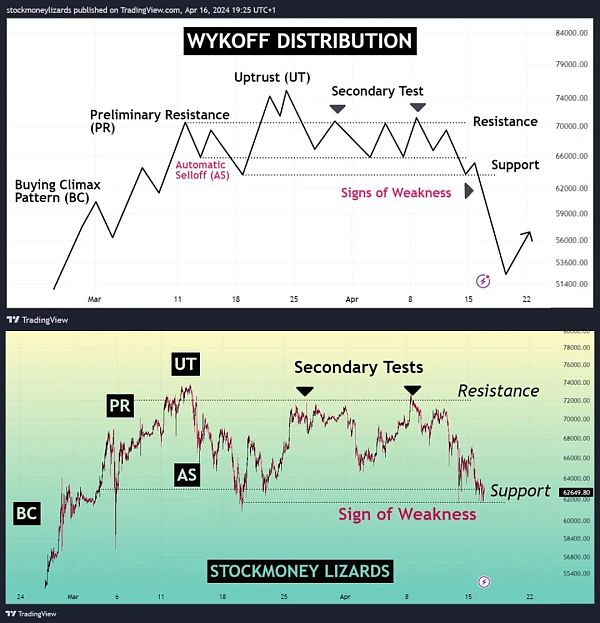
Technical graphics are always hindsight - only when the market has completed this pattern can people see clearly what this pattern is.
So at present, BTC is on the edge of a cliff: once the 62k support falls through, the three-top decline will be enough for the bulls to drink a big pot.
Is it scary? Scary. It's right to be scary. This is called "conquering the enemy without fighting."
If the bulls were scared and took the initiative to withdraw their leverage. The market would not fall so much. Because short-selling also has a price, the most important price is that the coin hoarders picked up the bargain and intercepted the chips.
But if the bulls are unwilling to be decent themselves and still take the risk of placing high leverage. Then the market will definitely not be polite and will definitely help the bulls to be decent.
In short, the benefits of exploding the long leverage must be higher than the cost of losing chips by selling at a discount. This is a cost-effective deal.
The netizen then analyzed several factors:
First, macroeconomics: core retail data rose, indicating rising inflation. The Fed does not want to cut interest rates. People are worried that the Fed will continue to raise interest rates. This is a bearish factor.
Second, geopolitical situation: Iran’s small-scale attack has made the market nervous and worried about the escalation of the situation. World War III has become a hot search. If the situation really escalates, the market may further pull back.
Third, technical graphics: (A) Historically, when BTC breaks through the "previous high", it often continues to climb. (B) After the output is halved, BTC usually climbs.
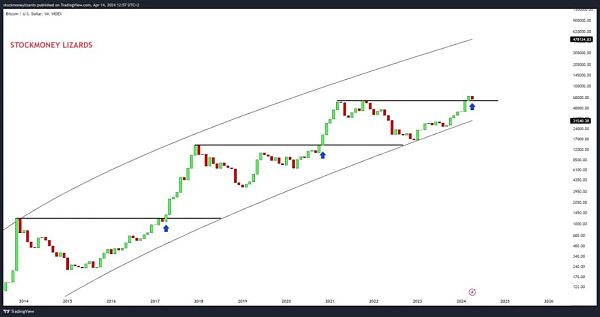
However, Jiaolian reminds readers that his previous point is actually not accurate. A typical example is that after breaking through the "previous high" of $1,100 at the end of 2013 in January 2017, it oscillated and washed for nearly 4 months before truly starting the bull market journey in 2017. It is very clear if you look at the chart of that year:
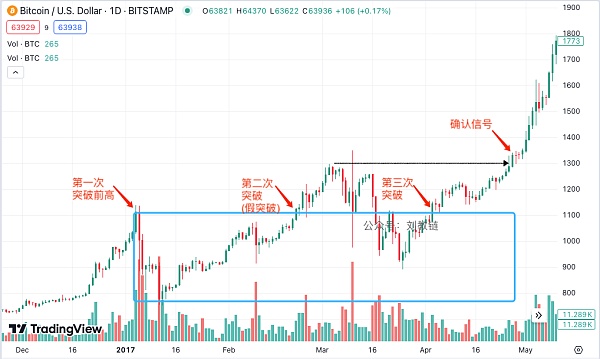
After breaking through the previous high for the first time, there was an immediate deep pullback, with a retracement of nearly -30%.
After breaking through the "previous high" in 2021 in early March 2024, it has only oscillated for more than a month and a half, with the maximum retracement of only about -15%.
Of course, the overall trend of the retracement and washing in 2017 was actually upward, not sideways or downward. According to the netizen, "given everything we are currently seeing on the macro side, the current chart pattern follows a typical Wyckoff distribution pattern, indicating that we will definitely see another corrective decline, and more negative news may fuel this trend." Therefore, he concluded that the market may enter a mid-term bear market.
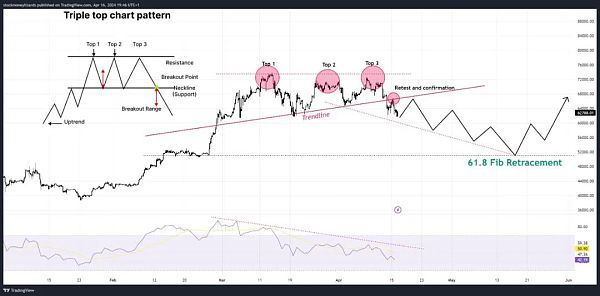
In addition, he also found some other "signals" from the chart, such as: triple tops; RSI shows fading momentum; neckline breakout and retest, etc. As shown in the figure below:
There is also the Elliott Wave Theory:
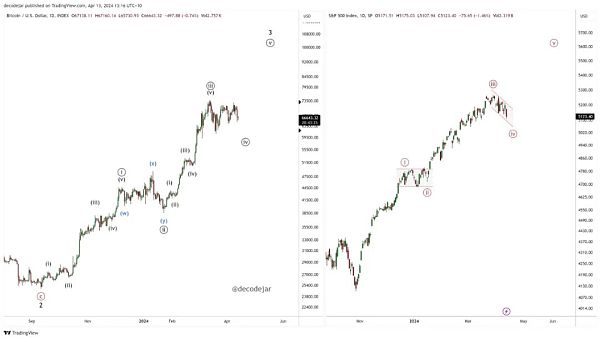
And various lines:
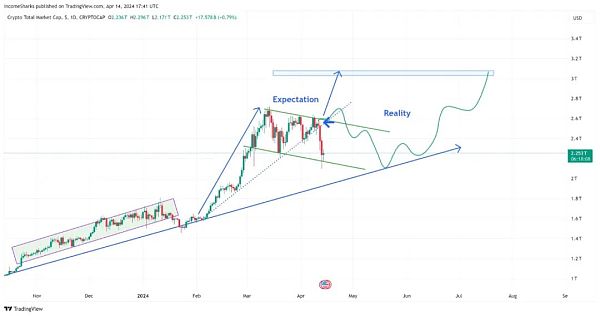
Note that the above picture is the total market value of the encrypted market, not the BTC line. For these, Jiaolian will not comment.
The netizen also noticed the spot ETF. He said: Large institutions have stopped buying. ETF inflows have slowed down significantly.
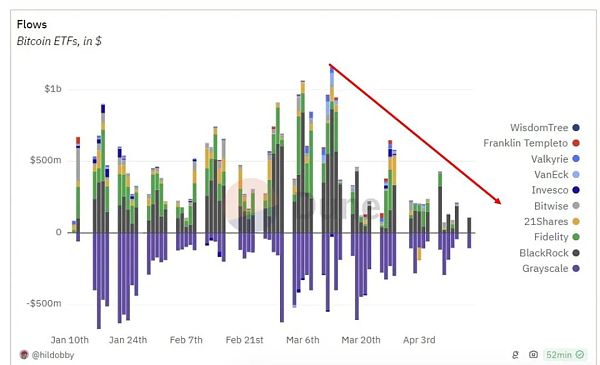
Jiaolian needs to make another correction here. In the 3.19 Jiaolian internal reference "Crypto Waterfall, Bad News Is Coming", it was mentioned: "According to Eric Balchunas, the iShares Bitcoin Trust (IBIT) issued by BlackRock, the world's largest asset management company, has an average of 250,000 transactions per day. The average transaction size is 326 shares, or about $13,000, which indicates that these transactions are conducted by non-professional investors."
So, it is not that "big institutions" have stopped buying, but that "retail investors" have stopped buying. For retail investors, they often buy when prices rise and do not buy when prices fall, just like the housing market. The slowdown in ETF buying is the result of falling prices, not the cause.
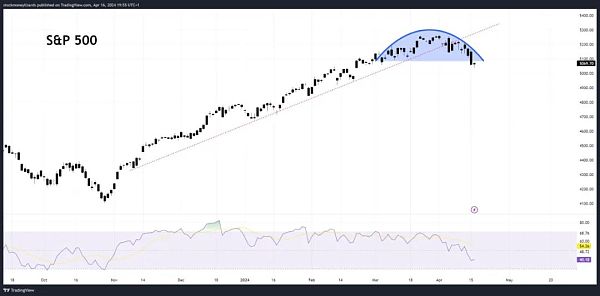
Finally, he mentioned that the U.S. stock market is also showing a top-down signal: a round top, and a trend line break. This may also have an impact on the crypto market.
His final conclusion is two-fold:
First, despite the obvious bullish signs (halving, new highs), there are some strong signals that we may see a mid-term correction. Depending on the flow of news events, this may happen more or less suddenly. BTC dominance will rise and altcoins will fall.
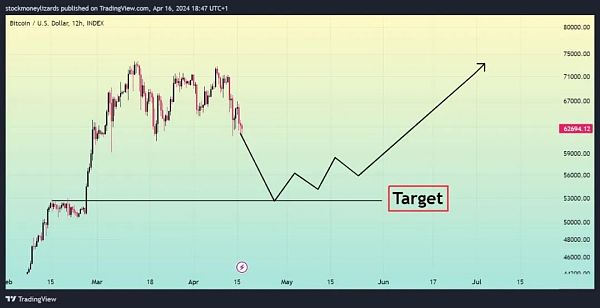
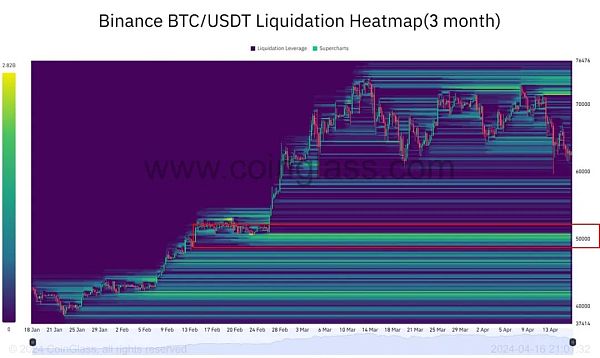
Second, despite the upcoming halving, we expect adjustments to continue. A potential target would be the 61.8 Fibonacci retracement level (lows of more than $50,000, where a lot of leverage can be liquidated). The bull market is not over. It's just taking a break. After a year of only rising and not falling, this wave of pullback is also acceptable.
 JinseFinance


