US-China Tech War? US Restricting China's Access to Cloud Technologies
U.S. contemplates clampdown on Chinese access to cloud technology amid escalating geopolitical tensions.
 Hui Xin

I woke up to find BTC below 67k.
Bitcoin has fallen again.
Breaking below $68k seems like just a normal technical correction, right?
Maybe not.
According to the latest analysis from CoinDesk and Cointelegraph[1][2], things are far more complicated than that. The financial mechanisms behind this drop may be brewing a self-reinforcing sell-off storm. And most retail investors may be completely unaware of this.
What is the negative gamma zone?
What is the negative gamma zone?
A Trap That Forces You to Sell
Let's take an analogy first.
Imagine you're the house in an options "casino." Today, a big client comes in and buys $1 million worth of put options—he's betting that Bitcoin will fall.
As the house selling put options, you need to hedge the risk. How do you hedge? Sell some of your Bitcoin spot holdings (because selling put options is equivalent to buying when the option is exercised, and selling spot holdings to hedge against it). This way, if the price does fall, the loss on the spot holdings can be offset by the option gains.
Now the problem is: if the price continues to fall, your hedging position needs to be further increased, which means continuing to sell more Bitcoin.
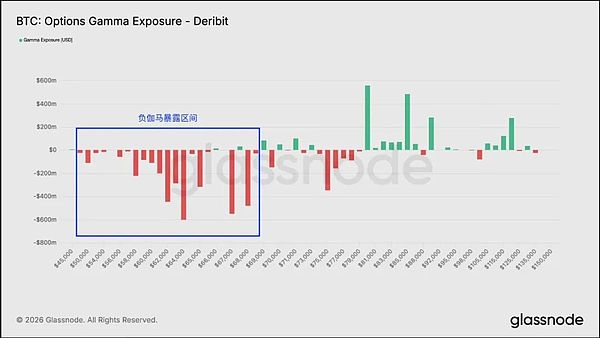
Selling will drive down prices, and driving down prices will require more selling... This is a death spiral. In the financial market, this phenomenon is called the Negative Gamma Zone. Glassnode data shows that from 68k down to 50k, the gamma exposure of market makers is basically negative[1]. What does this mean? It means that once Bitcoin falls below 68k, the entire market is like falling into a financial black hole, being pulled down by an invisible force.
68k is not an ordinary support level, it is the lid of Pandora's box
Why 68k in particular?
In the Deribit options market, a large number of traders bought put options at 68k and below. From 68k all the way down to the middle of 55k, there are densely packed defensive positions[1].
That's the key.
This is the key.
68k is not an ordinary technical level. It is the boundary of the options market structure. Breaking below it does not mean opening up a downside space—it means opening a switch for forced selling. CoinDesk analyst Omkar Godbole bluntly stated: Negative gamma is accumulating below the current price, and the area from 68k down to the high of 50k is in a risk zone [1]. In other words, this decline may not be the slow, steady decline you expect. Instead, it will accelerate, accelerate, and accelerate again. The technical aspects are also resonating. The signals from the options market are frightening enough. The technical outlook is also not optimistic.
Cointelegraph's analysis points out that a bearish flag continuation pattern has appeared on the Bitcoin 1-day chart[2]. This is not the first time. It was confirmed once on January 20, when the price retraced to $60,000. Now, a second bearish flag is forming.
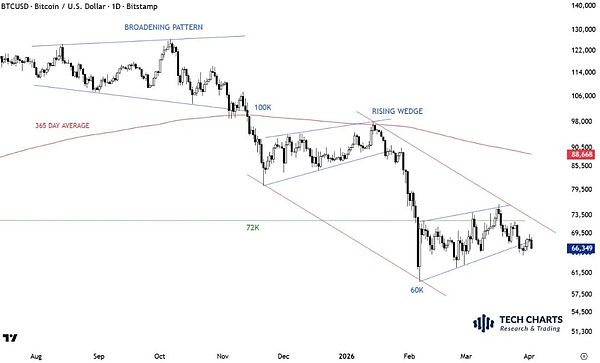
Since February 8, every rebound to the trendline at the upper edge of the flag has been ruthlessly suppressed.
How can this be reversed? Perhaps it will take several consecutive days of closing above 76k before retesting 75k to confirm a support-resistance reversal [2]. Otherwise, the bearish pattern will continue to dominate. Technical analyst Aksel Kibar's prediction is more straightforward: if it breaks below the lower boundary, it may move towards $52,500 [2]. 52,500...... Macro environment: adding fuel to the fire. Some might say, isn't Bitcoin quite resilient? Oil prices have risen to levels not seen since 2008, the Iraq War is still raging, the S&P 500 is down 3.95% year-to-date, and Bitcoin is still fluctuating between 60k and 73k. Isn't that pretty strong? Indeed, it is. But the problem is that technical and options market risks are accumulating, while the macroeconomic environment is not only not improving, but is deteriorating. This may not be resilience, but rather the calm before the storm. Liquidity Trap: No April Fool's Jokes During the Easter Holiday There's another detail that many people might overlook. After the options expire on March 27, market liquidity was already quite thin. Then comes the Easter holiday, and liquidity is likely to remain low [1]. What does this mean? It means that if a spiral sell-off in the negative gamma zone is triggered, there may not be enough buyers in the market to take over. Dancing on thin ice is inherently dangerous. If there's a death vortex waiting beneath the ice, it's not just a matter of walking on thin ice. Some Thoughts on Chain Reaction First, the area below 68k is a danger zone. This doesn't mean a price drop is inevitable, but rather that the risk mechanism in this area is different. With a normal technical pullback, you can try to profit from a rebound. But in the negative gamma zone, bottom-fishing might be like bravely catching a knife with your bare hands during a self-reinforcing sell-off. This isn't explained by fundamentals; it's determined by market structure. Second, 60k is crucial. If 60k holds, and the price continues to oscillate between 60k and 70k, the risk is manageable. If the 60k level fails, it means the defensive position established in February has been completely breached. The market must then find the next defensive position. Third, before bottom-fishing, carefully calculate your available funds and holding plan. Adding to positions on dips is not speculative bottom-fishing to bet on a rebound. In the negative gamma zone, any speculative mentality can be exploited by the market structure. Without the determination and ability to hold long-term, your willpower may be ruthlessly crushed before the market. Fourth, 75k may be the dividing line between bull and bear markets. As repeatedly mentioned in 2025, the power-law bottom at the end of the 2026 bear market year was at 70k. With a safety cushion, a recovery to 75k or even higher by the end of the year might confirm the end of the bear market and the start of a recovery phase. Until then, effective risk management and surviving bull and bear markets are more important than precisely buying at the bottom. Finally, let's use an analogy to describe Bitcoin's current situation. Imagine you're walking on a narrow mountain path, with a cliff on the left and a precipice on the right. You feel confident walking. But what you don't know is that the path beneath your feet is actually a huge sheet of thin ice, beneath which lies an abyss. 68k is where this ice begins to thin. This is not alarmist. This is mathematics, market structure, and the balance sheets of countless market makers speaking for themselves. ChainChain certainly hopes Bitcoin can hold above 60k, rebound to above 75k, and continue to reach new highs. But hope alone is not enough. Understanding the risks and preparing accordingly is the key to long-term survival. When the beast attacks, it's best to make sure your gun is loaded.
U.S. contemplates clampdown on Chinese access to cloud technology amid escalating geopolitical tensions.
Hui XinUnder current federal legislation, providing such services remains tightly regulated, effectively excluding many businesses, particularly small independent operators, from the benefits of conventional banking.
 Brian
BrianAstar Network and Startale Labs, both Singapore-based entities, have entered into an agreement with KDDI Corporation, a Japanese telecommunications company, to explore collaboration in the Web3 domain.
 Joy
JoyAmidst a backdrop of rising optimism for Bitcoin ETFs and regulatory shifts, Lyn Alden argues that the anonymity of Bitcoin's creator, Satoshi Nakamoto, fortifies the cryptocurrency's foundational tenets of decentralization. Alden's perspective adds another layer to the evolving narrative of crypto legitimacy.
 YouQuan
Blockchain security experts are raising concerns about the Safereum project's developers, who have reportedly sold off a significant amount of their native token after the project successfully concluding a $600,000 fundraising campaign.
 Aaron
AaronMicrosoft recently announced intentions to invest a significant A$5 billion ($3.2 billion) to strengthen its presence in the Australian market.
Hui XinOnly one region has seen an increase in crypto adoption- but how sustainable is it?
 Clement
According to DTCC’s spokesperson, appearing on the list is not indicative of an outcome for any outstanding regulatory or other approval processes.
 Catherine
BlackRock has agreed to pay the $2.5 million fine in a bid to resolve the charges brought forth by the SEC.
 Kikyo
KikyoRecent transfers of substantial digital assets from #FTX and #Alameda wallets to #Binance and #Coinbase have sparked speculation about potential asset sales, amid concerns over the upcoming Bitcoin ETF.
Brian