Bybit Eyes Expansion: Seeks Crypto Trading License in Hong Kong
Bybit applies for a Hong Kong license, signaling strategic expansion and intensifying competition in the burgeoning Asian cryptocurrency market.
 Brian
Brian

Source: Vernacular Blockchain
The liquidity of the crypto market has been in crisis recently. After months of sideways fluctuations, Bitcoin has once again dropped to a low of $86,000, a correction of nearly 20% from the high point. As the leader of cryptocurrencies, the decline of Bitcoin has brought about the collapse of a number of altcoins, and market sentiment has also turned from greed in the MeMe period to panic.
Is the bull market in cryptocurrencies still there? Will Bitcoin break upward again?This must be a topic of concern to many people. However, the current trend of Bitcoin is closely related to the global financial market. Sam Callahan, a research analyst at Swan Bitcoin, wrote an article on the relationship between Bitcoin prices and global liquidity that is worth reading.
The following is the main text:
Bitcoin is in line with global liquidity 83% of the time in any 12 months, a higher proportion than any other major asset class, making it a powerful indicator of liquidity conditions.
Despite the high correlation between Bitcoin and global liquidity,it is not completely immune to short-term deviations, especially during periods of extreme valuations, disturbed by specific events or market internal dynamics.
Combining global liquidity conditions and Bitcoin on-chain valuation indicators can provide a more nuanced understanding of Bitcoin's cyclical changes, helping investors identify moments when market internal dynamics may temporarily deviate from Bitcoin's liquidity trend.

Understanding how asset prices fluctuate with changes in global liquidity has become key for investors to improve returns and effectively manage risks.In today's market, asset prices are increasingly directly affected by central bank policies, and liquidity conditions have become the main factor driving asset prices, while fundamentals alone no longer play a decisive role.
This has been particularly evident since the global financial crisis (2007-2008).Since then, more and more unconventional monetary policies have become the dominant force driving asset prices. By leveraging liquidity, central banks have turned markets into one big trade, and as economist Mohamed El-Erian puts it, central banks have become the “only protagonists.”Stanley Druckenmiller agrees, noting that “yields don’t drive the overall market; it’s the Fed…look to the central bank, look to changes in liquidity…Most people in the market are looking for yields and traditional indicators, but it’s liquidity that drives the market.”
This is particularly evident when looking at the close correlation between the S&P 500 and global liquidity.
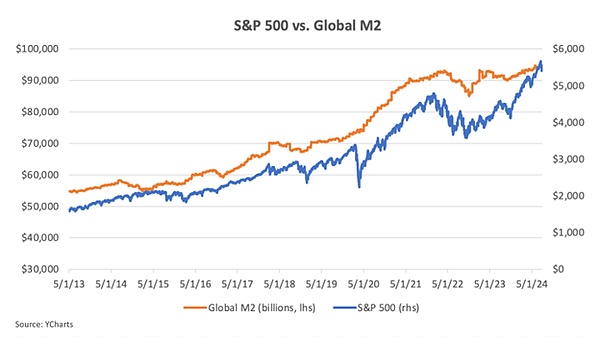
The explanation for the above chart comes down to simple supply and demand. If more money is available to buy assets, whether it’s stocks, bonds, gold, or Bitcoin, the prices of those assets will generally rise.Since 2008, central banks have pumped a lot of fiat money into the system, and asset prices have risen accordingly. In other words, monetary inflation drives asset price inflation.
Against this backdrop, understanding how to measure global liquidity and how different assets react to changes in liquidity has become key for investors to navigate liquidity-driven markets.
There are many ways to measure global liquidity, but for this analysis, we will use global M2 - a broad measure of money supply that covers physical currency, demand deposits, savings deposits, money market securities, and other forms of easily accessible cash.
Bitcoin Magazine Pro provides a measure of global M2 that aggregates data from eight major economies: the United States, China, the Eurozone, the United Kingdom, Japan, Canada, Russia, and Australia. This measure is a good proxy for global liquidity because it reflects the total amount of money available for spending, investment, and borrowing worldwide. In other words, it can be viewed as a measure of the total amount of global credit creation and central bank money printing.
It is important to note that global M2 is denominated in US dollars. Lyn Alden explains why this is important in an article:
The strength of the dollar is crucial because it serves as the world's reserve currency and is the primary unit of account for global trade, contracts, and debt. When the dollar strengthens, countries' debt burdens increase; when the dollar weakens, their debt burdens decrease. The global broad money supply, denominated in dollars, is a key measure of global liquidity. How fast are units of fiat currency being created? How strong or weak is the dollar in global currency markets?
When global M2 is denominated in dollars, it reflects not only the relative strength of the dollar, but also the pace of credit creation, making it a reliable indicator of global liquidity conditions.
While there are other ways to measure global liquidity, such as looking at short-term government debt or the global foreign exchange swap market,for the rest of this article, when referring to "global liquidity," we will refer to it as "global M2."
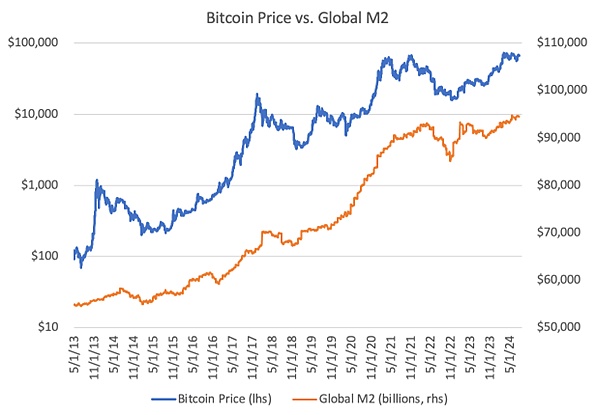
Over the years, one of the assets that has shown a strong correlation with global liquidity is Bitcoin. As global liquidity expands, Bitcoin generally performs strongly; when liquidity contracts, Bitcoin tends to perform poorly. This dynamic has led some to call Bitcoin a "liquidity barometer."
The chart below clearly shows how Bitcoin's price has been aligned with changes in global liquidity.
 Similarly, comparing Bitcoin to the year-over-year change in global liquidity further highlights the close correlation between the two. When liquidity increases, Bitcoin's price rises; when liquidity decreases, Bitcoin's price falls.
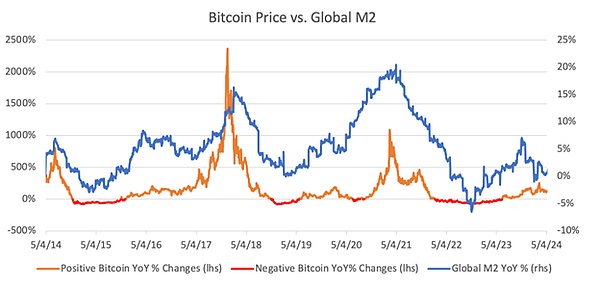 As can be seen from the above chart, Bitcoin's price is very sensitive to changes in global liquidity. But is it really the most liquidity-sensitive asset in today's market?
Overall, risk assets have a more pronounced correlation with liquidity conditions. In an environment of abundant liquidity, investors tend to adopt higher risk/high return investment strategies and move funds into assets that are perceived as riskier; conversely, when liquidity tightens, investors often move into assets they perceive as safer. This could explain why assets like stocks generally perform well when liquidity increases.
However, stock prices are also affected by other factors that are not related to liquidity. For example, the performance of stocks is partly driven by earnings and dividends, so their prices tend to be correlated with economic performance. This may weaken the pure correlation between stocks and global liquidity. In addition, U.S. stocks are affected by passive inflows into retirement accounts such as 401(k)s, which affect their performance regardless of liquidity conditions. These passive inflows may provide a buffer for U.S. stocks during liquidity fluctuations, making them less sensitive to global liquidity conditions.
The relationship between gold and liquidity is more complicated. On one hand, gold benefits from increased liquidity and a weaker dollar; on the other hand, it is also seen as a safe haven asset. When liquidity shrinks and markets turn to risk-averse behavior, investors seek safety, which may increase demand for gold. Therefore, even if liquidity is drained from the system, the price of gold may still perform well. This means that the performance of gold is not necessarily closely related to liquidity conditions. Similarly, bonds are also seen as safe haven assets, so their correlation with liquidity conditions may be low.
Back to Bitcoin, unlike stocks, Bitcoin has no yield or dividends, and there is no structural buying that affects its performance. Compared to gold and bonds, most capital pools still view Bitcoin as a risk asset during its adoption cycle. This may keep Bitcoin relatively pure in terms of global liquidity.
If this holds true, it is a valuable insight for investors and traders of Bitcoin. For long-term holders, understanding Bitcoin's correlation with liquidity can provide deeper insights to help analyze the driving forces behind price movements. For traders, Bitcoin is an effective tool to express views on the future direction of global liquidity.
This article aims to delve into Bitcoin’s correlation with global liquidity, compare it to other asset classes, identify periods when correlation breaks, and share insights on how investors can use this information to gain an edge in the future.
When analyzing the correlation between Bitcoin and global liquidity, it is important to consider both the strength and direction of the correlation. The strength of the correlation reveals the degree of synchronization between the two variables. A stronger correlation means that changes in global M2 have a more predictable impact on Bitcoin prices, whether moving in the same direction or in the opposite direction. Understanding this strength is key to assessing Bitcoin’s sensitivity to fluctuations in global liquidity.
By analyzing data from May 2013 to July 2024, Bitcoin’s strong sensitivity to liquidity can be clearly seen. During this period, the correlation between Bitcoin prices and global liquidity reached 0.94, showing an extremely strong positive correlation. This suggests that Bitcoin prices were highly sensitive to changes in global liquidity during this time period.
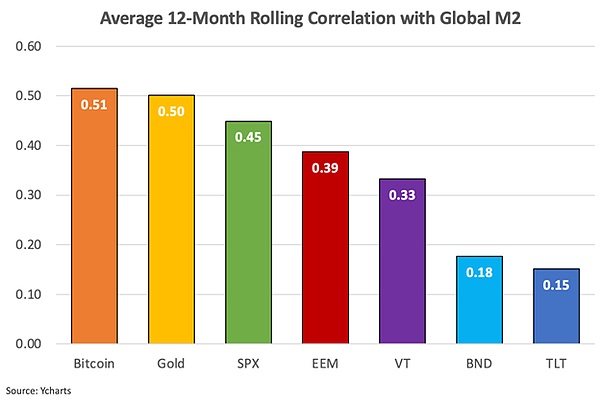
However, if we look at the 12-month rolling correlation, the average correlation between Bitcoin and global liquidity drops to 0.51. This is still a moderately positive correlation, but significantly lower than the overall correlation.
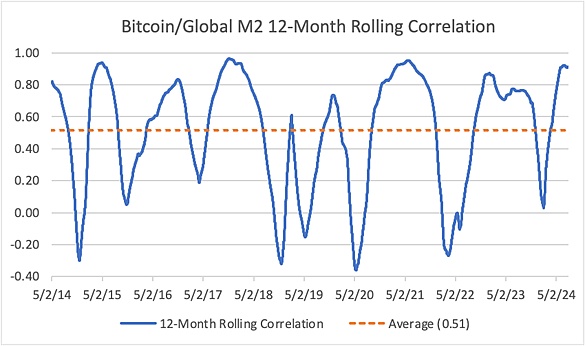
This suggests that Bitcoin's price has not remained so closely tied to liquidity on a year-on-year basis. Furthermore, when looking at the 6-month rolling correlation, the correlation drops further to 0.36. This means that as the time frame shortens, the deviation between Bitcoin's price and its long-term liquidity trend increases, suggesting that short-term price fluctuations are more likely to be affected by factors specific to Bitcoin itself rather than liquidity conditions.
To better understand Bitcoin’s correlation with global liquidity, we compared it to other assets, including the SPDR S&P 500 ETF (SPX), Vanguard Total Global Equity Index ETF (VT), iShares MSCI Emerging Markets ETF (EEM), iShares 20+ Year U.S. Treasury Bond ETF (TLT), Vanguard Total Bond Market ETF (BND), and gold.
On a rolling 12-month timeframe, Bitcoin has the highest average correlation with global liquidity, followed by gold. Stock indices have slightly weaker correlations, while bond indices have the lowest correlation with liquidity, as expected.
When analyzing asset correlations with global liquidity by year-over-year change, stock indices have slightly stronger correlations than Bitcoin, followed by gold and bonds.
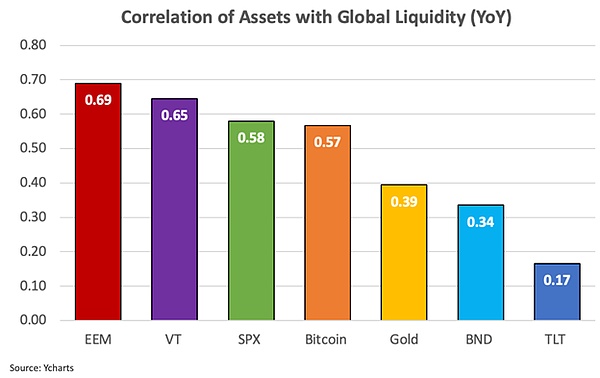
One reason why stocks may be more closely correlated with global liquidity in year-over-year changes than Bitcoin is Bitcoin's high volatility. Bitcoin often experiences large price fluctuations within a year, which may distort its correlation with global liquidity. In contrast, stock indexes generally show smaller price fluctuations, making them more consistent with year-over-year changes in global M2. Nonetheless, Bitcoin still shows a moderately strong correlation with global liquidity in the year-over-year analysis.
The above data highlights three key points:
1) The performance of stocks, gold, and Bitcoin is closely related to global liquidity;
2) Bitcoin has a strong overall correlation compared to other asset classes and has the highest correlation over a rolling 12-month period;
3) Bitcoin's correlation with global liquidity weakens when the time frame is shortened.
Bitcoin’s directional consistency with liquidity makes it unique. As mentioned earlier, a strong positive correlation does not guarantee that the two variables will always move in the same direction, which is particularly true in volatile assets such as Bitcoin, which may temporarily deviate from the long-term relationship with relatively stable indicators such as global M2. Therefore, combining these two aspects, strength and direction, can provide a more complete understanding of the interaction between Bitcoin and global M2.
By examining the directional consistency of this relationship, we can better understand the reliability of its correlation, which is particularly important for investors who focus on long-term trends.If you know that Bitcoin tends to follow the direction of global liquidity changes most of the time, you can have more confidence in predicting its future price movements based on changes in liquidity conditions.
In terms of the stability of directional consistency, Bitcoin has the highest directional consistency with global liquidity among all the assets analyzed.The probability that Bitcoin moves in the same direction as global liquidity is 83% over a 12-month period and 74% over a 6-month period, highlighting the consistency of the directional relationship.
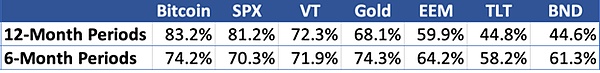
The chart below further demonstrates the directional consistency of Bitcoin and global liquidity over a 12-month period, compared to other asset classes.
These findings are important because they show that, while the strength of the correlation may vary by time frame, Bitcoin's price direction is generally consistent with the direction of global liquidity. Furthermore, Bitcoin's price direction is closer to global liquidity than any other traditional asset.
This analysis shows that the relationship between Bitcoin and global liquidity is not only significant in strength, but also very stable in directional consistency. The data shows that Bitcoin is more sensitive to liquidity conditions than other traditional assets, especially over longer time frames.
For investors, this means that global liquidity may be a key driver of Bitcoin's long-term price performance, and should therefore be taken seriously when evaluating Bitcoin market cycles and predicting future price fluctuations. For traders, this means that Bitcoin has become a highly sensitive investment tool that expresses views on global liquidity, suitable for investors who have a strong belief in liquidity.
Despite Bitcoin’s strong overall correlation with global liquidity,the study found that Bitcoin’s price tends to deviate from liquidity trends over shorter rolling periods. These deviations may be due to internal market dynamics exerting a greater influence at certain moments in Bitcoin’s market cycle, or triggered by events specific to the Bitcoin industry.
These individual events refer to events that occur within the broader crypto industry and often lead to rapid changes in market sentiment or trigger large-scale liquidations. For example, major bankruptcies, exchange hacks, regulatory developments, or the collapse of Ponzi schemes are typical examples of such events.
Looking at historical instances of weakening 12-month rolling correlations between Bitcoin and global liquidity, it is clear thatBitcoin’s price tends to decouple from liquidity trends when major industry events occur. The figure below shows the breaks in Bitcoin’s correlation with liquidity when these major events occur.
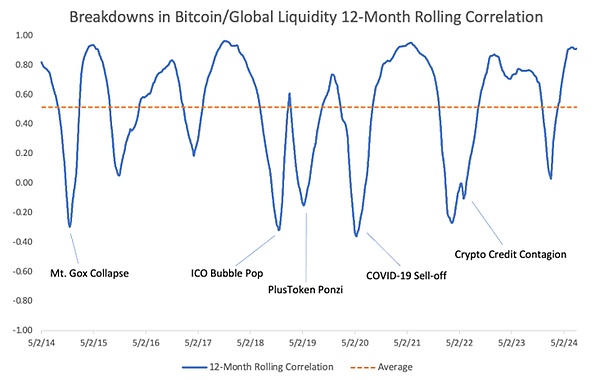 Key events such as the collapse of Mt. Gox, the unravelling of the PlusToken Ponzi scheme, and the crypto credit collapse triggered by the collapse of Terra/Luna and the bankruptcy of multiple crypto lenders have all led to panic and selling pressures that were largely unrelated to global liquidity trends.
The 2020 COVID-19 market crash provides another example. Bitcoin initially experienced a sharp decline amid widespread panic selling and risk aversion. However, Bitcoin quickly rebounded as central banks took unprecedented liquidity injection measures, highlighting its sensitivity to liquidity changes. The correlation break at that time was mainly due to a sudden shift in market sentiment rather than changes in liquidity conditions.
While it is important to understand the impact of these individual events on Bitcoin's correlation with global liquidity, their unpredictability makes them less actionable for investors. However, as the Bitcoin ecosystem matures, infrastructure improves, and regulatory clarity increases, I expect the frequency of these "black swan" events to decrease over time.
Aside from individual events, another notable pattern in Bitcoin's weakening correlation with liquidity is that this often coincides with periods when Bitcoin prices reached extreme valuations and subsequently fell sharply.This was particularly evident during the peaks of the bull markets in 2013, 2017, and 2021, where Bitcoin's liquidity correlation decoupled as prices fell significantly from their highs.
While liquidity primarily affects demand, understanding the distribution patterns on the supply side can also help identify periods when Bitcoin may deviate from its long-term correlation with global liquidity.The main source of available for sale is profit-taking by old holders as Bitcoin prices rise. In addition, there will be new issuance from block rewards, but this portion is relatively small and continues to decrease with each halving event. During bull markets, old holders tend to reduce their holdings and sell them to new buyers until new demand reaches saturation. At this saturation point, the peak of the bull market usually occurs.
The key indicator to assess this behavior is the Bitcoin HODL Wave for one year and above, which measures the percentage of Bitcoin held by long-term investors who have held for at least one year as a percentage of the total circulating supply. In simple terms, it reflects the proportion of the available supply held by long-term investors at any given moment.
Historically, this indicator usually falls during bull markets as long-term holders choose to sell; and rises during bear markets as they accumulate. The figure below highlights this behavior, with the red circle marking the cycle peak and the green circle indicating the bottom. 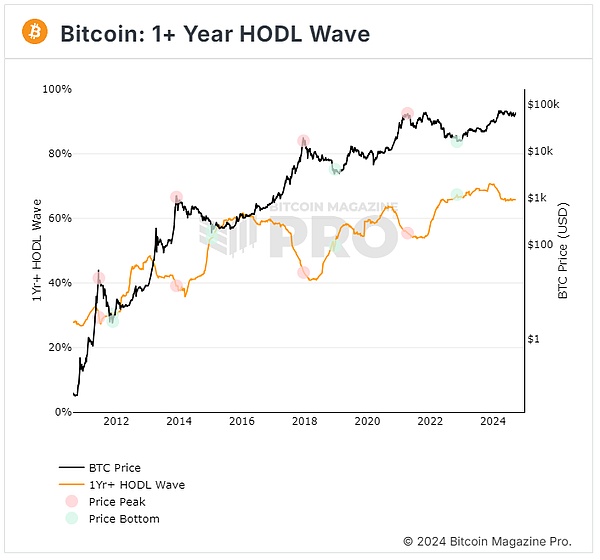
This illustrates the behavior of long-term holders during Bitcoin cycles. Long-term holders tend to take profits when Bitcoin is seen as overvalued, and tend to accumulate when Bitcoin is seen as undervalued.
The question becomes… “How can one tell if Bitcoin is undervalued or overvalued, so as to better predict when supply will flood into or out of the market?”
Although the dataset is still relatively small, the Market Value vs. Realized Value Z-Score (MVRV Z-score) has proven to be an effective tool for identifying when Bitcoin has reached extreme valuation levels.
The MVRV Z-score is made up of three components:
1) Market Value - Current market capitalization, calculated by multiplying the price of Bitcoin by the total number of coins in circulation.
2) Realized Value - The average price at which each Bitcoin or Unspent Transaction Output (UTXO) was last traded on-chain, multiplied by the total circulating supply, essentially the on-chain cost basis for Bitcoin holders.
3) Z-Score - This score measures how far market value deviates from realized value, expressed as a standard deviation, and highlights periods of extreme overvaluation or undervaluation.
When the MVRV Z-score is high, it means there is a large gap between the market price and the realized price, and many holders are enjoying unrealized profits. While this is intuitively a good sign, it can also be a sign that Bitcoin is overvalued or overbought - meaning long-term holders may start distributing their Bitcoin and taking profits.
Conversely, when the MVRV Z-score is low, the market price is close to or below the realized price, which indicates that Bitcoin is undervalued or oversold - a good opportunity for investors to start accumulating.
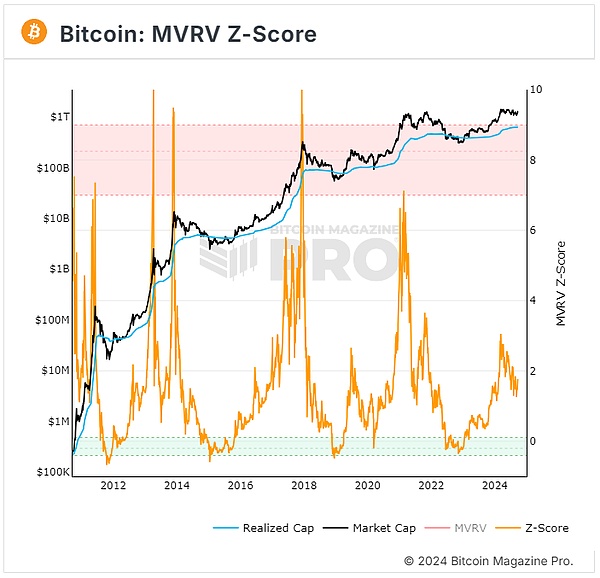
When overlaying the MVRV Z-score with the 12-month rolling correlation between Bitcoin and global liquidity, a clear pattern can begin to be identified. When the MVRV Z-score drops sharply from its all-time highs, the 12-month rolling correlation appears to drop as well. The red rectangle below highlights these periods.
This phenomenon suggests that when Bitcoin prices reach extremely high valuation levels and begin to adjust, their correlation with global liquidity may weaken. This weakened correlation reflects the impact of supply-side dynamics and the dominant role of market sentiment on price behavior. During these periods, long-term holders often choose to sell at a profit, while short-term traders may overreact to price fluctuations, resulting in a disconnect between the short-term movement of Bitcoin prices and changes in global liquidity conditions.
This analysis provides investors with important insights to help them identify potential shifts in the relationship between Bitcoin and liquidity, as well as possible market adjustments at high valuation levels.
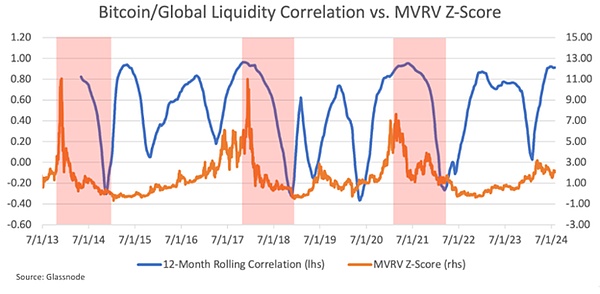
This suggests that when Bitcoin's MVRV Z-score declines from high levels and its correlation with liquidity weakens, internal market dynamics (such as profit-taking and panic selling) may have a greater impact on Bitcoin prices than global liquidity conditions. At extreme valuation levels, Bitcoin’s price action tends to be driven more by sentiment and supply-side dynamics than by global liquidity trends.
This insight is important for traders and investors because it helps identify those rare moments when Bitcoin deviates from its long-term liquidity correlation. For example, let’s say a trader strongly believes that the U.S. dollar will depreciate and global liquidity will rise over the next year. According to this analysis, Bitcoin would be the best vehicle to express this view because it serves as the purest barometer of liquidity in the market.
However, these findings suggest that traders should first assess Bitcoin’s MVRV Z-score or other similar valuation metrics before placing orders. If Bitcoin’s MVRV Z-score indicates extreme overvaluation, traders should remain cautious despite a positive liquidity environment because internal market dynamics could overwhelm liquidity conditions and trigger a price correction.
By simultaneously monitoring Bitcoin’s long-term correlation with global liquidity and its MVRV Z-score, investors and traders are better able to predict how Bitcoin’s price will respond to changes in liquidity conditions. This approach enables market participants to make more informed decisions and potentially improve their chances of success when investing or trading Bitcoin.
The strong correlation between Bitcoin and global liquidity makes it an important macroeconomic barometer for investors and traders. Not only is this correlation strong, it also exhibits a high degree of directional consistency when compared to other asset classes. Bitcoin can be thought of as a mirror that reflects the pace of global money creation and the relative strength of the U.S. dollar. And unlike traditional assets such as stocks, gold or bonds, Bitcoin's correlation with liquidity remains relatively pure.
However, Bitcoin's correlation is not perfect. Studies have found that the strength of Bitcoin's correlation decreases over shorter time frames, which emphasizes the importance of identifying moments when the correlation between Bitcoin and liquidity may break down. Internal market dynamics, such as idiosyncratic shocks or extreme valuation levels, can cause Bitcoin to temporarily deviate from global liquidity conditions. These moments are critical for investors as they often mark price corrections or accumulation phases.
Combining global liquidity analysis with on-chain metrics such as the MVRV Z-score can help to better understand Bitcoin's price cycles, and help identify moments when prices are more likely to be driven by market sentiment rather than broad liquidity trends.
Michael Saylor once famously said, "All your models are destroyed." Bitcoin represents a paradigm shift in money itself. Therefore, no statistical model can perfectly capture the complexity of the Bitcoin phenomenon,but some models can serve as useful tools for decision guidance, despite their imperfections. As the old saying goes, "There are models that work, but there are some that work."
Since the global financial crisis (2007-2008), central banks have distorted financial markets through unconventional policies, making liquidity the primary driver of asset prices. Therefore, understanding changes in global liquidity is critical for any investor who hopes to succeed in today's markets. In the past, macro analyst Luke Gromen has described Bitcoin as "the last working smoke alarm" because of its ability to signal changes in liquidity conditions, an analysis that has also been supported.
When the alarm bells sound for Bitcoin, investors should listen carefully in order to effectively manage risks and position themselves appropriately to seize future market opportunities.
Bybit applies for a Hong Kong license, signaling strategic expansion and intensifying competition in the burgeoning Asian cryptocurrency market.
BrianThe Ethereum Dencun upgrade, featuring proto-dank sharding, promises lower costs and improved efficiency, marking a major leap in Ethereum's scalability and blockchain innovation.
 Weiliang
Cybertrace warns of a deep fake video featuring Andrew Forrest promoting a fake crypto platform, highlighting the rising threat of sophisticated digital scams.
 Miyuki
Despite China's crypto crackdown, a 2023 Kyros Ventures report shows 33.3% of Chinese investors favor stablecoins, ranking second after Vietnam at 58.6%, indicating a high risk appetite. 70% state cryptocurrencies make up over half of their portfolios.
 Joy
JoyAvalanche's Durango upgrade, featuring the innovative Avalanche Warp Messaging (AWM), redefines blockchain interoperability, marking a significant leap in seamless, secure cross-chain communication and technological advancement.
 Alex
AlexOPNX shuts down, citing regulatory hurdles and financial penalties. Users urged to settle positions and secure assets before the February 14 deadline.
BrianBinance strategically froze $4.2 million of stolen XRP, bolstering Ripple's recovery efforts and showcasing its commitment to security and collective resilience in the crypto community.
AlexBinance faces a lawsuit from a former Gaza hostage and families affected by a Hamas attack, accusing the exchange of financing terrorism. The legal battle sheds light on alleged links between Binance and illicit transactions, prompting a call for accountability in the cryptocurrency industry.
JoyElon Musk captivates with a “420” tweet, celebrates Neuralink's breakthrough “Telepathy” chip, and continues to redefine tech and social media landscapes.
BrianStarbucks Korea's game-changing NFT strategy, unveiled on Jan. 16, is not just reducing single-use cups by 600,000 but also rewarding eco-friendly sippers with exclusive digital artwork, setting a new standard in sustainable coffee experiences.
Joy