Note: The first 100% Solana collateralized ETF will be listed on the NYSE on the evening of the 28th. What impact will this have on the price of Solana? Bitwise conducted research, compiled by Golden Finance, and the following is:
Key Points
Under simplified assumptions of today's market conditions, assuming the current inflow and price multiplier (1.5x) remain constant, a net inflow of $1 billion would correspond to a price increase of approximately 34% for Solana.
We expect the relationship between capital flows and price action to strengthen as the asset becomes institutionalized.
Previous spot cryptocurrency ETFs have historically been "sell-the-news" events.
Introduction
The approval of spot BTC and ETH ETFs in the United States on January 11, 2024, and July 24, 2024, respectively, were undoubtedly historic. These events marked a sea change in the legitimacy of cryptocurrencies as portfolio assets, accelerated adoption by institutional investors, and solidified digital assets as a component of mainstream finance.
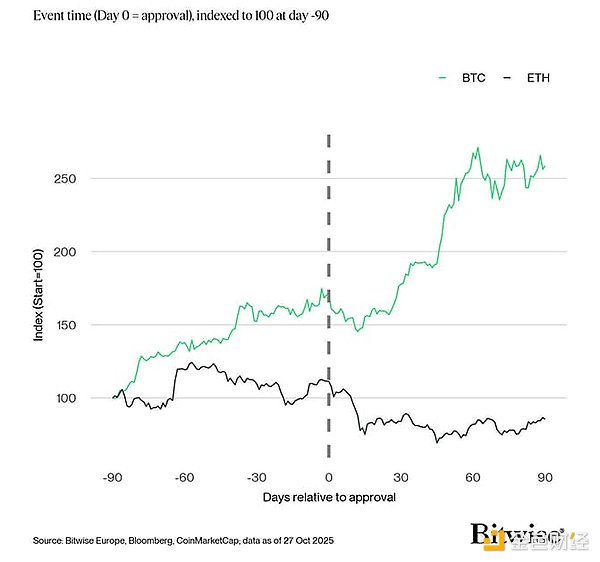
While Europe has long been more open to cryptocurrency exchange-traded products (ETPs), the United States, under the supervision of regulators such as Jay Clayton and Gary Gensler, has lagged behind in a disruptive and politically charged manner. Clayton is a conservative skeptic, while Gensler brought his "cryptocurrency-savvy" expertise to the adversarial battle. After facing legal losses and reputational damage, the U.S. Securities and Exchange Commission (SEC) approved both assets, representing a final regulatory green light. The Solana ETF application follows the path set by spot Bitcoin and Ethereum ETFs, using the same commodity-based trust share framework and relying on the monitoring sharing arrangements associated with CME Solana futures. Solana is the sixth-largest cryptocurrency by market capitalization (~$110 billion), but its CME futures market is more liquid and larger than its closest competitor, XRP (fifth-largest by market capitalization; ~$157 billion), with >$100 million per day and an average of $266 million per day in July 2025. Solana's CME futures market should be sufficient to allay the SEC's concerns about "manipulation of a large, unregulated market." This follows the introduction of universal listing standards, which allow qualified companies to launch funds with a single click. This doesn't necessarily automatically drive the asset forward, but it does transform crypto assets from "little-known currencies tied to wallets on a blockchain" to "stock tickers accessible to anyone with a brokerage account." This will set the stage for an upward movement in the asset as fundamentals and market sentiment converge with traditional finance (Trad-Fi). This article aims to decipher whether the SOL ETF listing will have an impact on the price of SOL. SEC Approval is a "Sell the News" Event The price action following these approvals suggests that while ETF launches are bullish in the long term, they can be a "sell the news" event in the short term. Both assets initially traded lower before reversing higher within approximately two weeks of approval. BTC Approval (January 2024): BTC had already risen approximately 1.75x in the 90 days prior to its approval, as the market had already priced in the approval and trading with strong momentum as it entered the second year of its four-year cycle. This pullback is a classic example of profit-taking following a strong signal event. ETH Approval (July 2024): Ethereum's price action was more chaotic, trading sideways prior to its approval. The market's impact on an ETH ETF was uncertain, in part because inflows into BTC ETFs were still relatively low at the time, leading to uncertainty about whether the ETF would structurally shift demand.
BTC and ETH price performance before and after spot ETF approval

Both assets ultimately benefited from ETF approval, but the initial reaction reflected that the market had already preempted the decision.
History doesn't repeat, but it always rhymes
If history is any guide, SOL's ETF approval could see a similar pattern: a short-term decline or muted reaction, followed by long-term structural support. This approval had been widely discussed and anticipated, so it's unlikely to be completely unexpected, especially given the approval of an existing ETF.
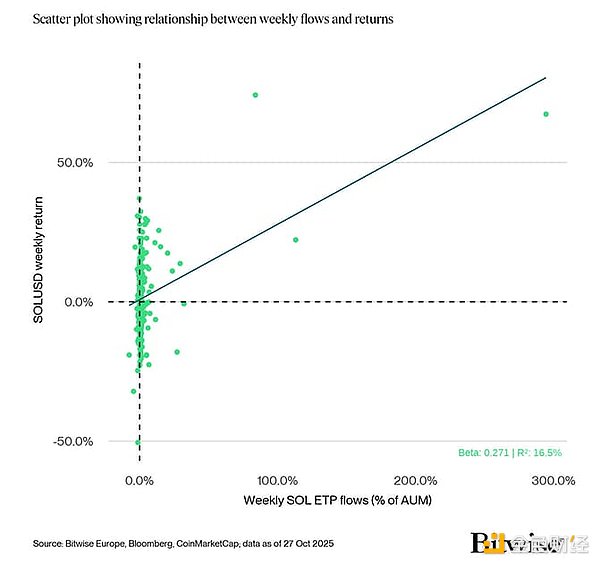
The relationship between SOL ETP flows (as a percentage of AUM) and SOL returns exhibits an average beta of 0.269, meaning that, on average, a 1% inflow into SOL ETPs (relative to AUM) is associated with a +0.269% change in SOL's weekly returns.
However, the R² is only approximately 16.5%, meaning that flows explain less than one-fifth of the overall return variation across the entire observation sample. In other words, while a directional relationship exists, the majority of SOL's price movements are likely driven by factors outside the scope of this analysis.
Most of the data points are tightly clustered around zero flow, with only a few extreme weeks (outliers, with flows reaching 50% to 300%) causing an upward shift in the regression line. This suggests that the relationship is primarily influenced by large ETP flow events, rather than "normal" weeks. Our sample size includes 13 SOL stocks, ranging from VSOL SW Equity with 1041 days (September 21, 2021) to SSK US Equity (the first SOL-backed ETF) with 82 days. Net fund flow data are aggregated by the number of weeks since each stock's inception.
SOL Weekly Returns vs. SOL ETP Weekly Flows (% of AUM)

Solana ETP Flows Are Growing, but Remain Subordinate
Since Q4 2024, and particularly in the past few months, global inflows into Solana ETPs have grown dramatically, currently holding approximately $3.9 billion in total assets under management (AUM). This represents significant traction among institutional investors, but remains small relative to Bitcoin and Ethereum.
In Q4 2024, in the run-up to Trump's election victory, Solana outperformed, becoming the blockchain of choice for meme coin issuance. The defining meme coin issuance platform of this cycle, Pump.fun, is built on Solana's leading DEX, Raydium. At the peak of retail participation, Solana accounted for nearly 90% of all DEX trading volume. Meme coins accounted for a significant portion of this volume, and the Solana ecosystem benefited greatly from it. While ETP flows contribute, they are not the dominant driver. Even though inflows explain SOL's price action more strongly than ever at current levels (rising to approximately 20% by 2025), retail dynamics still dominate. There are two main reasons for this: 1. SOL remains a retail-dominated asset. It has been the foundational layer of the meme coin craze, with a significant portion of its trading volume tied to the token issuance platform. 2. In absolute terms, institutional inflows are relatively small. Given that ETP assets under management total approximately $3.9 billion, SOL remains a high-beta, high-risk asset, positioned higher on the risk curve for traditional financial portfolios. Institutional investors are participating, but on a small scale. Cross-Asset Correlation Matrix In the early stages of the bear market (2022), the rolling R² soared to over 40%, and the beta coefficient remained positive. This reflects periods of simultaneous redemptions and price declines—flows and returns are closely linked, with positive betas during these periods, as both are driven by forced selling or capitulation. In the first six months of 2022, prices fell by approximately 77%.
As the bear market entered 2023, prices fell by another approximately 77% by year-end, with betas approaching zero and sometimes even turning negative, and R² falling to extremely low levels. This suggests that inflows tend to be "sticky," or counter-trend—investors average into weak markets even when prices continue to fall. During this phase, inflows increase while returns decline, resulting in negative betas. Market behavior is driven more by external shocks (such as the FTX crash and widespread liquidity pressures) than by ETP inflows.
In contrast, the bull market of 2024-25 presents a different picture, with betas generally positive and R² values in the 10%-20% range. During these periods, flows tend to chase and amplify upside: new capital and allocations reinforce the upward momentum. While flows are not the sole driver of performance, they are closely correlated with prices during periods of high beta and robust R². Occasional negative spikes in beta during these periods are typically associated with pullbacks or market rebalancing events, such as new capital chasing gains from prior rallies, or redemptions during short-term pullbacks. How Net Inflows Affect Prices: Under the simplifying assumptions of today's market conditions, assuming the current flow-price multiplier (1.5x) remains constant, a $1 billion net ETF inflow would correspond to a price increase of approximately 38%. Note that this sensitivity table is purely concurrent; it does not incorporate any uncertainty (either R² or confidence/prediction intervals) into the price impact figures. Sensitivity of Solana Performance to Net ETP Fund Flows Institutional Allocation: Over the past 3.5 years, ETP fund flows have had varying degrees of influence on Solana's price performance. Much of this price volatility can be explained by factors outside the scope of this analysis. However, we believe Solana is likely to remain retail-dominated, driven by its role as the premier meme coin launch platform and its strong cultural cachet within the industry. Institutional investors may exert a greater influence on price trends in the future.
Conclusion
The US SEC's approval of the Solana ETF will mark another milestone for the industry, but it won't necessarily boost its development in the short term. Historical experience suggests that, as with BTC and ETH, the approval of this ETF will be somewhat pre-priced in, leading to a higher risk of an initial pullback.
In the long term, ETFs should enhance and increase the asset's appeal to institutional investors by providing a low-cost, bankruptcy-proof package for the underlying securities. This will gradually increase institutional participation and may explain the increased volatility in Solana's price movements over time, while the "multiplier" (beta coefficient) will increase, thereby enhancing both-way price fluctuations.
 Hui Xin
 Hui Xin
 Davin
Davin YouQuan
 YouQuan
 Joy
Joy Hui Xin
 YouQuan
 Joy
Joy Hui Xin
 YouQuan