Author: @JustDeauIt; Compiler: Plain Language Blockchain
There are many misconceptions about Ethereum and Solana on the timeline. It’s time to cut through the noise with a data-driven approach.
That’s why I created this awesome dashboard that compares the economics of the two networks on:
It’s both quantitative and qualitative analysis.
Next are some highlights and a final dashboard link via @tokenterminal ?
1. Network costs
It’s now about 50% cheaper to transact on Arbitrum than on Solana. In fact, it’s even cheaper on the first few L2s.

2. Turning to total network fees:
Highlights:
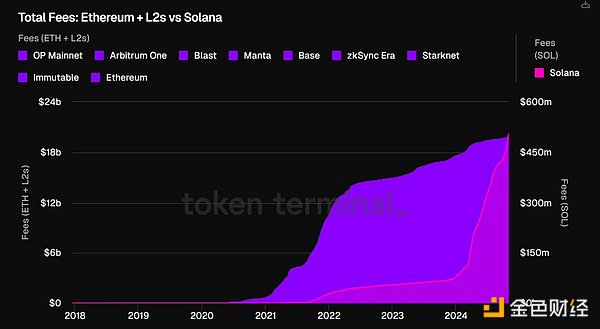
Total fees for Ethereum and top L2s are approaching $20 billion. 97.5% of fees come from L1 (top L2 has $479M in fees). Solana has $495M in total historical fees, 87% of which was generated this year.
The trend is in Solana's favor, with Solana generating 41% of Ethereum's total network fees (excluding MEV) over the past 90 days. As for why L2 is included, it's because they create demand for ETH and settle transactions to L1. If these two economic links are broken, we will no longer consider them.

3. Protocol Income
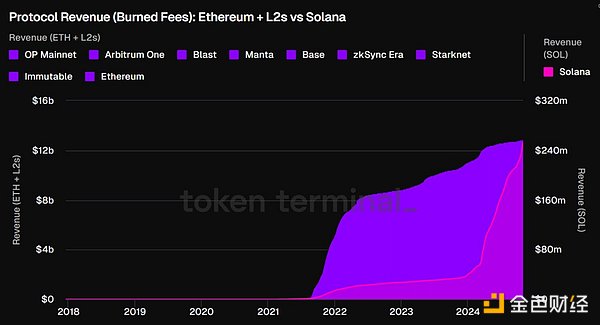
Next is the protocol income (the destroyed tokens, bringing value to non-stakers):
Key points:
64% of Ethereum's historical transaction fees ($12.4 billion) have been destroyed, accumulating value for ETH Token holders.
50% of Solana's historical transaction fees ($247 million) have been destroyed (accounting for only 2% of Ethereum).
Currently L2 has no value accumulation mechanism for token holders.

4. Supply-side fees (paid to validators)
Key points:
Ethereum has paid $7 billion (36%) of historical fees to supply-side validators ($400 million so far this year).
Solana paid $247 million ($212 million so far this year).
How does Solana fill the gap? Through Token incentives/inflation. Solana has issued $3.2 billion in incentive payments so far this year, while Ethereum is $2.3 billion.

5. Comparison of total economic value (network fees + MEV + Token incentives)
Key points:
In the past 90 days, Ethereum's total economic value was $1.03 billion (58% of which came from Token incentives).
During the same period, Solana's total economic value was $1.19 billion (79% of which came from Token incentives).
If we focus on real economic value (fees + MEV), Ethereum ($431M) surpasses Solana ($254M) during the same period.
Over 51% of Solana’s real economic value comes from MEV (measured by Jito fees) compared to 29% for Ethereum (measured by Flashbots fees).

6. Cost of generating $1 in revenue
Key points:
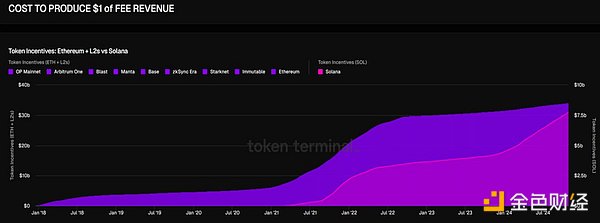
Here, we measure the expenditure of token holders (token incentives) to generate $1 in fees.
*Token incentives = cost for unstaked token holders, revenue for stakers/validators.
To date, Ethereum has paid $2.65 billion in token incentives to generate $2.06 billion in network fees ($1.28 per $1 in fees).
During the same period, Solana paid $3.26 billion to generate $428 million in fees ($7.62 for every $1 in fees generated).
From an on-chain perspective, an L1 becomes profitable when its fee income can compensate the supply side of the network without relying on token incentives/inflation.
Ethereum reached this point in most of 2023 and Q1 2024. However, after the EIP-4844 network upgrade, fees fell, making the network slightly inflationary (0.4% annualized based on Q3 inflation).
Solana has not yet achieved on-chain profitability, and its current inflation rate is close to 5% (which is necessary in the early stages - Ethereum also had high inflation in its early formative years).

The above is a brief overview of some of the data-driven and qualitative insights you can get in @tokenterminal’s dashboard.
 Kikyo
Kikyo


