Author: Alan; Source: WebX Lab Daily
Is the current market bullish or bearish? Although everyone should have their own understanding, there are still many intuitive data for reference.
We have selected the following indicators for everyone to judge the current market status:
1.BTC-ahr999 Hoarding Index
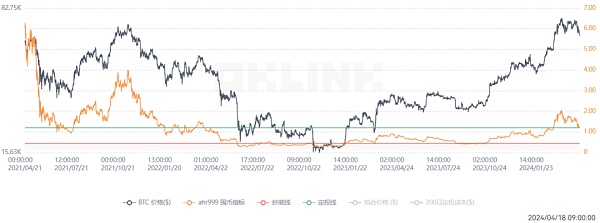
This index is used to evaluate the high and low prices of Bitcoin and determine the right time to buy. Values <0.45 are the bottoming range; 0.45-1.2 are the fixed investment range; 1.2-5 are the bull market range; >5 are the high-risk range. The last updated value was 1.73, and the current value is 1.18, falling back to the fixed investment range. 2. Two-year MA multiplier indicator This indicator shows that the price of Bitcoin has broken through the green line at a price of about $29,000 in October 23, and is no longer at a historical low, but the current price needs to double before it has a chance to break through the red line. [Note: The two-year MA multiplier indicator is intended to be used as a long-term investment tool. It highlights the periods in which buying and selling Bitcoin will generate huge returns. To do this, it uses the 2-year moving average (equivalent to the 730-day line, green line), and the 5-fold product of the moving average (red line).
Historically, when the price falls below the 2-year moving average (green line), it is a bottom-buying signal, and buying Bitcoin will generate excess returns. When the price is above the 2-year moving average x 5 (red line), selling Bitcoin is effective for profit. 】
3. The proportion of coins held for more than 1 year
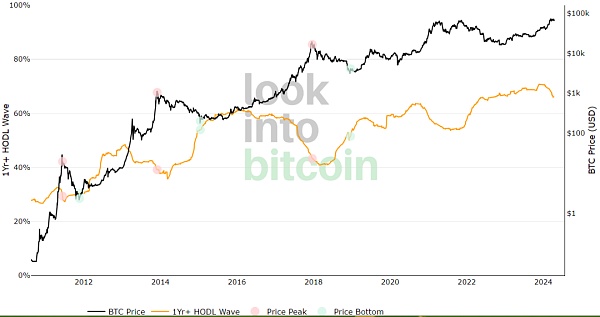
The highest data in the last bear market cycle was 65.93%, and the current 66.09% (according to historical rules, less than 45% is a high-risk area, but the lowest in the last bull market was only 53.94%).
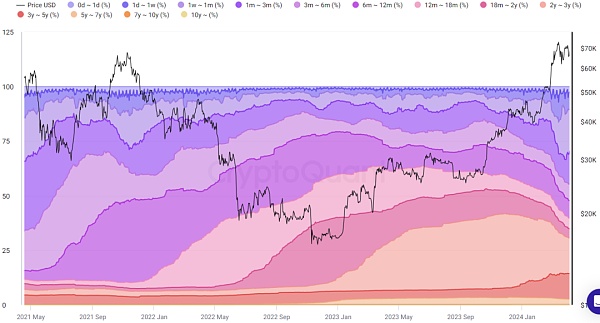
The realized value of the coin holding ratio of more than 6 months was 77% at the bottom of 2015, 70% at the bottom of 2019, and 47.9% at the top of 2021. The highest value in this bear market was around 79%, the last update was 49.14%, and it is currently 47.42%.
4. MVRV indicator
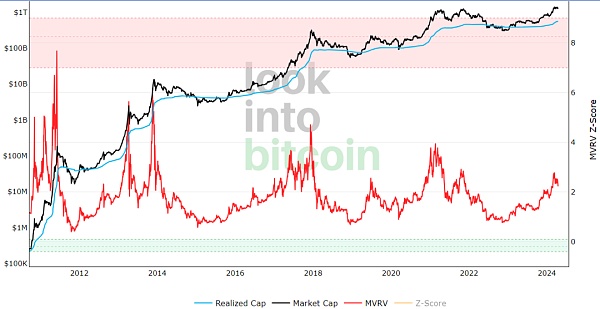
The indicator is around 2.23, and the last updated data was 2.54 (above 3 is high risk, below 0.1 is a super bottom). MVRV is a relative indicator, which is the ratio of the market value (Market Cap, MV) to the realized market value (Realized Cap, RV). It was first proposed by Murad Mahmudov & David Puell, and its expression is: MVRV = MV / RV, Realized Cap is based on the UTXO model, which calculates the sum of the "corresponding value at the time of the last move" of all coins on the chain. Compared with the circulating market value (current circulation * market price), RV has the following advantages:
(1) Reduces the impact of the part that has been withdrawn from circulation (or the part that has been lost)
(2) Takes into account the market value of each coin on the chain when it flows
(3) Can indirectly reflect the chip cost of long-term holders
A higher MVRV ratio (> 1.0) means that there is a large degree of unrealized profit in the system. Historically, a value exceeding 3.0 indicates an overheated bull market.
A low MVRV ratio (<1.0) means that the market price is lower than the average purchase price of participants on the chain. This is typical of the late bear market, usually associated with bottom formation and accumulation.
5.NUPL indicator
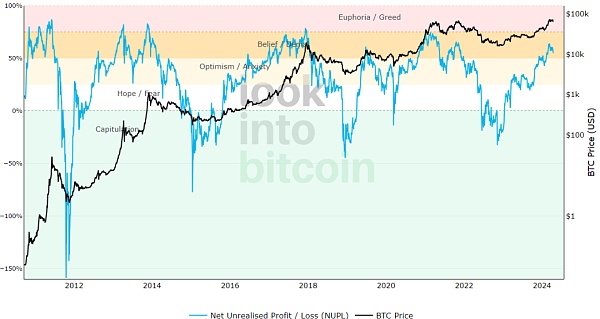
This indicator has been stable in the "belief" area for nearly a month.
The inventor of the NUPL indicator is Adamant Capital, a market research institution and Bitcoin investment institution, and further summarized by data scientist Rafael Schultze-Kraft.
The general algorithm is the difference between the Bitcoin market value (Market Value) and the realized market value (Realized Value, which is the market value of the dollar value of the token when it last moved on the blockchain network) divided by the market value. Rafael believes that when different thresholds are set for the NUPL value, the current state of the cycle can be clearly distinguished.
The indicator formula is as follows:
NUPL = Relative Unrealized Profit - Relative Unrealized Loss
NUPL = (Current Currency Market Value - Realized Currency Value) / Current Currency Market Value
When the market value rises much faster than profit taking, we see an overheated market. For strategic investors, historically, when the excitement period is reached (in the red band) it is conducive to profit taking.
6. Puell Multiple Indicator
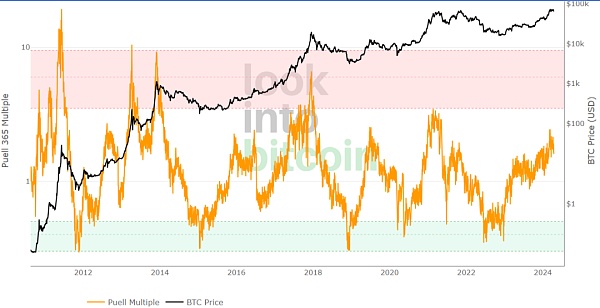
The green area is a buy signal and the red area is a sell signal. However, the last bull run did not touch the red zone and has now stabilized in the neutral zone.

Indicator Overview: Value of Bitcoin mined on a certain day/365-day average. Puell Multiple is calculated by dividing the daily token issuance value (in US dollars) by the 365-day moving average of this value, which is currently around 1.98. Daily issuance refers to new tokens added to the ecosystem by miners, who receive tokens as block rewards. Miners usually pay for mining costs by selling tokens to the market.
7.RHODL indicator
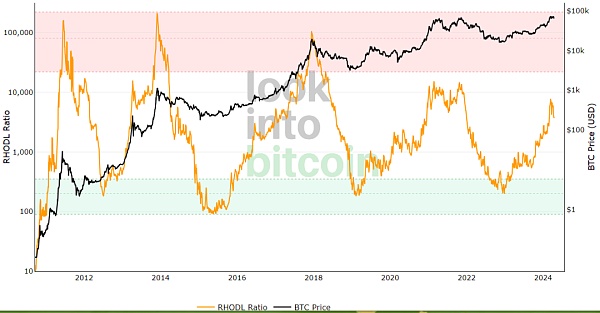
This indicator has been in the neutral zone recently.
The RHODL indicator was created by Philip Swift in December 2020.
When the RHODL ratio begins to approach the red band, it may indicate that the market is overheated. Historically, this has always been a good time for investors to take profits in each cycle.
Unlike other on-chain indicators, the RHODL ratio will not give a false signal of the cycle high in April 2013, which gives it a unique advantage over other on-chain indicators. But the last bull market did not approach the red band and did not give a signal for profit taking.
8. Reserve Risk
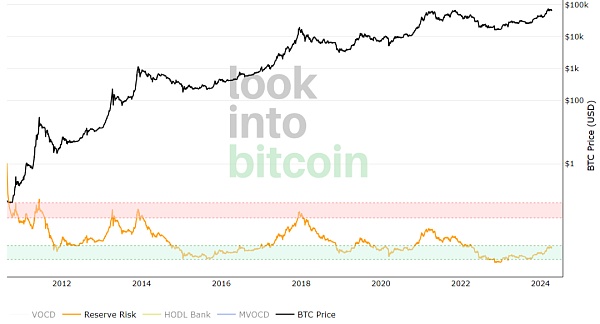
The reserve risk indicator can reflect the confidence of long-term Bitcoin holders in the price of Bitcoin at a specific time.
When confidence is high and prices are low (green area), investing in Bitcoin has a higher risk-return; conversely, investing in Bitcoin when confidence is low and prices are high (red area) will result in losses.
This indicator shows that at the high point of the last bull market, Bitcoin was still a long way from the red area (top signal).Currently, this indicator is still in the green buy area when other indicators have increased significantly.
9. Number of whale wallet addresses
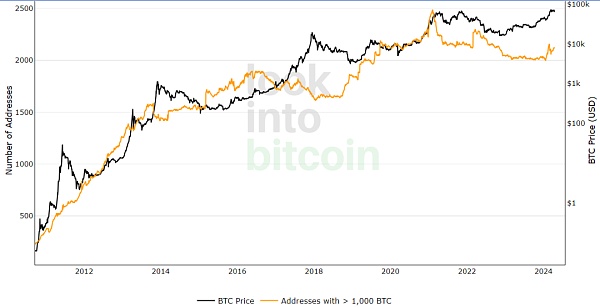
In February 2022, the number of whales soared from 2100 to 2280 and then showed an overall downward trend, and has rebounded in the past two months. The last update was 2095, and the current number is 2125.
This data can be used with other address balance charts to understand whether Bitcoin adoption is increasing or decreasing overall over time, and whether usage by specific groups is increasing or decreasing.
 PANewslab
 PANewslab
 Beincrypto
 Beincrypto
 Coinlive
  Globenewswire
 Bitcoinist
 Ftftx
Ftftx Cointelegraph
 Cointelegraph
 Cointelegraph