After reaching an all-time high earlier this year, Bitcoin has been consolidating, with the price briefly dipping below $100,000 for the first time since June. Macroeconomic headwinds, a weak stock market, and one of the largest liquidations in cryptocurrency history have collectively dampened market sentiment, slowed capital inflows, and raised questions about the sustainability of the bull market. Furthermore, growing concerns that large holders or "OG whales" might transfer or sell their early Bitcoin holdings have put pressure on Bitcoin and the overall cryptocurrency market. Following the recent decline, the total market capitalization of cryptocurrencies is currently approaching $3.6 trillion. Beneath the surface, Bitcoin's on-chain data provides important context. In this week's Coin Metrics Network State Report, we'll explore changes in Bitcoin holder behavior and how key demand drivers are influencing market sentiment and defining the rhythm of this cycle. By analyzing changes in active supply and the channels of demand, we will explore whether recent price fluctuations reflect end-of-cycle profit-taking or a deeper structural shift in the foundation of Bitcoin ownership. Supply Distribution Meets Institutional Absorption Demand Active Supply First, let's look at Bitcoin's active supply, which reflects Bitcoin's activity level based on its holding time and is divided according to the duration of the most recent on-chain transaction. This helps us understand the distribution of Bitcoin's supply between the inactive (dormant) portion and the portion with more recent transactions (also known as "HODL Waves"). Below, we separate the portion of Bitcoin's supply that has remained unchanged for more than a year as an indicator of Long-Term Holder Supply (LTH). Historically, this indicator rises during bear markets as Bitcoin concentrates in the hands of long-term holders, and falls during bull markets as these holders begin to move Bitcoin, realize profits, and diversify their investments.

Data source: Coin Metrics Network Data Pro
Currently, approximately 52% of Bitcoin's 19.94 million circulating supply has been idle for more than a year, down from approximately 61% at the beginning of 2024.
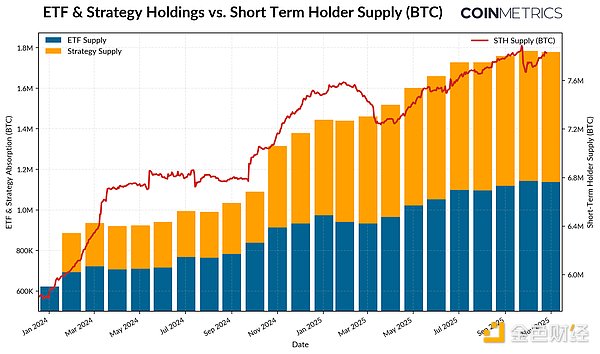
The sharp increases during the bear market and the sharp decreases during the bull market have both moderated significantly, with gradual distributions observed in the first and third quarters of 2024 and more recently in 2025. This indicates that long-term holders are distributing Bitcoin in a more sustainable manner, reflecting a longer-term transfer of ownership. ETFs and DATs as Demand Drivers: Conversely, since 2024, the supply from short-term holders (Bitcoins active over the past year) has steadily increased, with previously "dormant" Bitcoins re-entering circulation. This coincides with the launch of spot Bitcoin exchange-traded funds (ETFs) and the accelerated growth of digital asset treasury (DAT) reserves, both of which have introduced new and sustained channels of demand, absorbing the redistributed supply. As of November 2025, the number of active Bitcoins over the past year was 7.83 million, an increase of approximately 34% from 5.86 million at the beginning of 2024. This is primarily due to the re-entry of previously dormant Bitcoins into circulation. During the same period, the reserve holdings of spot Bitcoin ETFs and Strategy increased from approximately 600,000 to 1.9 million, absorbing nearly 57% of the net increase in supply from short-term holders. Currently, these instruments collectively account for approximately 23% of all short-term holder supply. While inflows have decreased in recent weeks, the overall trend reflects a gradual shift of supply to more stable, longer-term holding channels, a unique characteristic of the market structure in this cycle. 
Data source: Coin Metrics Network Data Pro and Bitbo Treasuries (Note: ETF supply excludes Fidelity's FBTC, DAT supply includes Strategy)
Behavior of short-term and long-term holders
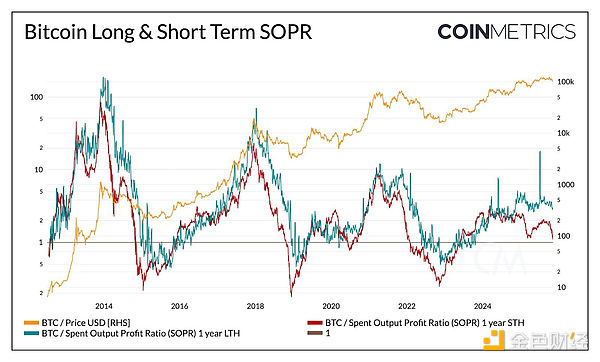
The realized profit trend reinforces the easing pattern presented in Bitcoin supply dynamics. The Realized Profit/Loss Ratio (SOPR) measures how much Bitcoin holders spend in a profitable or loss-making manner, providing a perspective on the behavior of different holder groups throughout market cycles. In previous cycles, the profits and losses of long-term and short-term holders tended to fluctuate dramatically and synchronously. However, recently, this relationship has diverged. Long-term holders have an SOPR slightly above 1, indicating that they are consistently realizing profits and moderately selling when the market is strong.

Data Source: Coin Metrics Network Data Pro
Short-term holders' SOPR has been hovering around the break-even point, which partly explains the recent cautious sentiment in the market, as many short-term holders' holding prices are close to their cost price. The divergence between different holding groups reflects that the market is in a more moderate phase, with institutional demand absorbing the redistributed supply, rather than experiencing rapid surges and crashes as in the past. **If the short-term SOPR can consistently break through 1, this could indicate strengthening market momentum.** While broader pullbacks will still compress profitability across various groups, the overall trend suggests that supply turnover and profit realization will gradually unfold, creating a more balanced structure and extending Bitcoin's cyclical rhythm. **This structural easing is also reflected in Bitcoin's volatility, which has been steadily declining over time.** Bitcoin's 30-day, 60-day, 180-day, and 360-day realized volatility has stabilized at around 45%-50%, significantly lower than its past periods of extreme volatility that led to pronounced boom-bust cycles. Today, Bitcoin's volatility is increasingly approaching that of large-cap tech stocks, indicating its maturation as an asset. This reflects both improved liquidity and a stronger institutional investor base. For asset allocators, this reduced volatility could increase Bitcoin's appeal in portfolios, especially given its still volatile correlation with macro assets like stocks and gold. Data Source: Coin Metrics Market Data Pro **Supply distribution is proceeding in waves, with the majority being absorbed by more persistent demand channels such as ETFs, DAT, and broader institutional holdings.** This shift suggests a more mature market structure, with decreasing volatility and velocity of flow, and longer cycles. Despite this, market momentum still depends on sustained demand. The leveling off of ETF inflows, pressure on some DAT holdings, recent market liquidations, and short-term holders' SOPR at breakeven all indicate that the market is in a readjustment phase. **The continued increase in supply from long-term holders (Bitcoins not traded for over a year), SOPR rising above 1, and a new wave of inflows into spot Bitcoin ETFs and stablecoins could be key signals of a strong market rebound.** Looking ahead, easing macroeconomic uncertainty, improved liquidity conditions, and progress in market structure regulation could help accelerate inflows again and extend the bull market. Despite a cooling of market sentiment, the market remains relatively healthy following the recent deleveraging adjustment, thanks to the growth of institutional channels and the widespread adoption of on-chain infrastructure.
 Alex
Alex
 Alex
Alex Weiliang
 Joy
Joy Weiliang
 Weiliang
 Kikyo
Kikyo Catherine
 Anais
Anais Kikyo
Kikyo Joy
Joy