Swarm Debuts Open dOTC for Tokenised Asset Trading
Swarm's Open dOTC platform innovatively enables tokenised trading of real-world assets, blending DeFi efficiency with regulatory compliance, marking a new era in asset tokenisation.
 YouQuan

The BTC/USDT trading pair maintains a leading position on most DEXs. ETH/USDC and ETH/USDT continue to rank in the top three by trading volume on Ethereum DEXs.
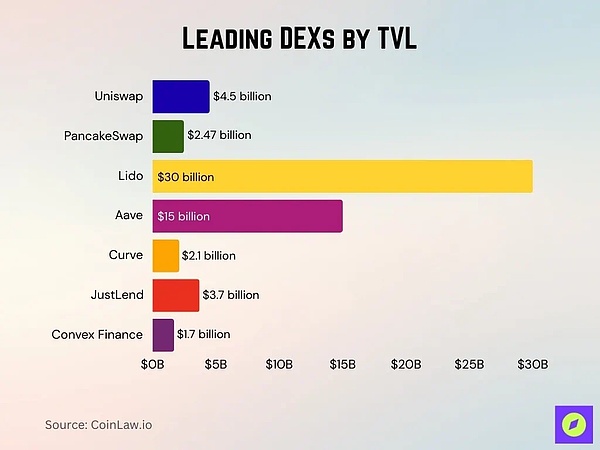
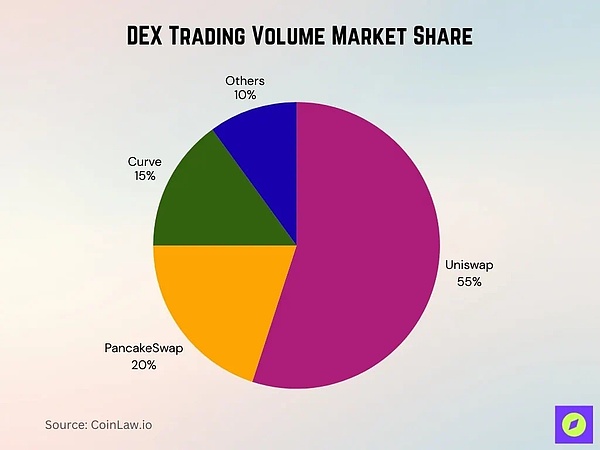
On Solana DEXs like Orca, SOL/USDC and SOL/USDT lead daily trading volume, with SOL-related trading pairs dominating. On Uniswap V4, high-liquidity pools are primarily stablecoin swaps and ETH/stablecoin pairs. The BNB/USDT trading pair is popular on BNB Chain and multi-chain DEXs, connecting BNB ecosystem tokens. On chain-agnostic aggregators, cross-chain/multi-hop trading pairs involving USDT, USDC, or ETH frequently occur. On derivatives DEXs like dYdX, BTC perpetual contracts against USD stablecoins and ETH perpetual contracts against USD remain mainstream trading pairs. Fee Structure and Cost Comparison: Most DEX standard pools have exchange fees between 0.20% and 0.30%. Some stablecoin pools offer lower fees, typically around 0.02% to 0.05%. Exchange fees primarily go to liquidity providers, with a small portion going to the protocol treasury. Some emerging DEXs are experimenting with 0% maker fees or subsidized fees to attract liquidity. On derivatives platforms like dYdX, maker and taker fees are typically low in basis points. Gas and network fees remain significant costs for many users. Aggregators sometimes reduce effective costs by routing funds to cheaper pools. Some DEXs employ flexible fee models, with higher fees for volatile trading pairs and lower fees for stablecoin pairs. DEX Platform Data by Blockchain Ethereum: DeFi protocols have an estimated TVL of approximately $78.1 billion, accounting for approximately 63% of DeFi's total TVL. Arbitrum: TVL of approximately $10.4 billion, a year-over-year increase of approximately 70%. Optimism: TVL is approximately $5.6 billion, more than doubling from approximately $2.3 billion in 2024. BNB Chain: TVL has grown modestly to approximately $7.9 billion. Base: TVL is approximately $2.2 billion, with continued growth since launch. Solana: Strong DEX activity, including high trading volume, high DEX usage share, and technical appeal (low fees, fast block times). Volume Distribution: ~67.5% of Uniswap's daily trading volume now occurs on the second layer network. PancakeSwap: It dominates BNB Chain, but its TVL composition also supports cross-chain activity. Liquidity Staking Protocol: While not strictly a DEX, it accounts for a significant portion of the TVL on chains like Ethereum. Liquidity Depth and Slippage: Stablecoin pools and major asset pairs offer higher liquidity depth. For volatile or less liquid tokens, slippage can be significant, ranging from 0.3% to over 1%. Pooled liquidity models reduce slippage by concentrating liquidity in active price ranges. Smart routing and aggregator tools reduce slippage by splitting trades across multiple pools. In rapidly moving markets, slippage can easily spike due to shallow liquidity and MEV activity. The average daily slippage for large trades on major DEXs has decreased compared to previous years. Many high-liquidity pools offer extremely tight spreads, often just a few basis points. A trader's effective costs include slippage, gas fees, routing fees, and exchange fees. Cross-chain and Multi-chain DEX Activity DEX trading volume is expected to grow by approximately 37% in 2025, reaching an average monthly trading volume of approximately $412 billion. Ethereum-based DEXs account for approximately 87% of decentralized trading volume. Solana DEX processes over $1.5 billion in daily trading volume, demonstrating strong competitiveness. Chains such as BNB Chain, Polygon, Base, Arbitrum, and Optimism are growing in importance. Cross-chain DEXs and bridges are increasingly used for arbitrage and liquidity migration. The use of aggregators supporting multiple chains is increasing as users seek the best fees. Liquidity fragmentation remains a challenge. Some multi-chain DEXs have introduced incentives to attract liquidity to less-used chains. Key Decentralized Storage Market Data: The global decentralized storage market was valued at US$622.9 million in 2024 and is projected to reach US$4.5 billion in 2034. From 2025 to 2034, the market is projected to expand at a strong compound annual growth rate (CAGR) of 22.4%. The public cloud segment alone is projected to exceed US$2 billion by 2034. The enterprise sector will account for 45% of the market share in 2024, reflecting high institutional adoption. North America will account for 40% of the market share in 2024, making it the leading region for decentralized storage adoption. Aggregators and Routing Volume: Weekly routing volume through aggregators such as 1inch and Matcha exceeds $3.9 billion. 1inch's 30-day average trading volume is approximately $8.6 billion. Ethereum DEX aggregator market share is becoming increasingly concentrated. Aggregators, acting as middleware, serve as an entry point for institutional funds, improving execution through gas optimization, MEV protection, and cross-chain routing. Some aggregators are building KYC and compliance features to attract institutions. Aggregate routing often spans multiple chains, increasing bridging risk and complexity. Smart Contract Audits and Security Incidents In the first quarter of 2025, Web3 lost over $2 billion due to vulnerabilities and attacks. In August 2025, 16 security incidents resulted in the theft of a total of $163 million. Cetus DEX was hacked in May 2025, resulting in losses of approximately $223-260 million. New Gold Protocol lost $2 million due to a flash loan vulnerability. Nemo Protocol on Sui suffered an exploit worth approximately $2.6 million. Approximately 80% of total crypto asset losses stem from DeFi protocols. While formal verification and auditing can mitigate losses, adoption varies. Vulnerabilities caused by unaudited code and logic flaws persist, hitting small DEXs the hardest. Trading Volume Market Share → Uniswap dominates the DEX market with a 55% share, making it the clear leader in trading volume. PancakeSwap holds 20%, firmly securing the second spot among decentralized exchanges. Curve accounts for 15%, with strong performance in liquidity provision and stablecoin swaps. Other DEXs account for a total of 10%, constituting a smaller but still competitive market segment.
The United States passed the GENIUS Act in July 2025, establishing a regulatory framework for stablecoin issuers.
By 2025, 90% of centralized crypto exchanges in North America will be fully compliant with KYC requirements. By 2025, the average compliance cost for crypto companies will increase by approximately 28% to $620,000 per year. Anti-money laundering (AML) and KYC protocols currently consume approximately 34% of compliance budgets.
Enforcement actions by the U.S. Commodity Futures Trading Commission (CFTC) increased by approximately 59% year-over-year.
DEX perpetual futures trading volume reached $898 billion in the second quarter of 2025.
Hyperliquid recorded $653 billion in trading volume in the second quarter, accounting for approximately 73% of the market share.
Growth is driven by demand for leverage, speculation, and hedging tools.
Institutional traders are increasingly participating in the perpetual contract market. Risk and compliance concerns remain major obstacles. Cross-chain perpetual swaps are emerging, bringing both opportunities and risks. For several quarters, derivatives trading volume has grown faster than spot DEXs. DEX User Demographics and Geographic Distribution By mid-2025, over 9.7 million unique wallets will interact with DEXs, up from approximately 6.8 million last year. Daily trading volume is concentrated in North America, Europe, and Asia. Among them, DEX adoption is growing faster in developing countries. Institutional users are concentrated in jurisdictions with clearer regulation. Gender distribution still favors men, but with a slight shift. Small-value transactions in Asia and Africa are more likely to be adopted on low-fee chains. Conclusion: The DEX sector is showing clear signs of maturity. Aggregators are not only tools for retail users but are increasingly becoming critical infrastructure for institutions. However, risks remain high, with vulnerability exploits, security lapses, and regulatory uncertainty posing a real threat.
DEX derivatives and perpetual contract trading has exploded, mobile and wallet-based platforms have become more attractive, and global user adoption continues to grow.
For traders and protocol developers, the key takeaways are:
Choose a DEX or aggregator that has undergone rigorous security audits
Prioritize chains and tools that reduce fees and slippage
As DEXs increasingly approach centralized alternatives in terms of trading volume, liquidity depth, and trust, the coming years will test which platforms can withstand the challenges of security, compliance, and usability.
Swarm's Open dOTC platform innovatively enables tokenised trading of real-world assets, blending DeFi efficiency with regulatory compliance, marking a new era in asset tokenisation.
YouQuanAustralian and Californian individuals face DOJ charges for a $25-million AI-driven crypto Ponzi scheme, involving false promises, fund diversion for personal expenses, and efforts to conceal investments under different names.
 Hui Xin
US authorities have seized around $500,000 in digital currency from a Chinese national implicated in a pig-butchering crypto scam. The ongoing case highlights law enforcement's adaptability in addressing crypto fraud challenges, emphasizing the need for stronger regulations to protect investors.
 Joy
JoyAmidst market fluctuations, XRP demonstrates resilience and potential for growth, maintaining a steady uptrend in a challenging crypto landscape.
YouQuanInsomniac Games, developer of Spider-Man 2, faces a Bitcoin ransom demand, raising concerns of potential data release unless 50 BTC is paid within seven days, causing tension in both gaming and cryptocurrency communities.
Hui XinLeading tech companies collaborate with the Cloud Security Alliance in a pioneering initiative to promote responsible AI development, focusing on ethical practices and risk mitigation.
YouQuanMirai Labs, the brains behind the horse racing game Pegaxy, has made a significant move to Avalanche, integrating SocialFi with esports economics into blockchain gaming. This transition aims to elevate the gaming experience for guild members, supporters, and casual gamers through enhanced engagement and interaction.
JoyTrump debuts 'MugShot' NFTs, blending legal challenges, political aspirations, and crypto innovation in a unique collection capturing the first-ever mugshot of a U.S. President.
Hui XinChina's Blockchain-based Service Network (BSN) is set to introduce RealDID, a groundbreaking initiative led by the Ministry of Public Security, for its 1.4 billion citizens. The scheme aims to establish the world's first national-level decentralised identity system, impacting the identity verification landscape.
JoyTerra co-founder Do Kwon confronts extended Montenegro detention amid extradition, intertwining with Terra's 2022 collapse fallout in the crypto market.
Hui Xin