Author: digitalassetresearch Source: substack Translation: Shan Ouba, Golden Finance
This week, the stock market fell from its all-time highs, cryptocurrencies struggled under the newly launched ETH ETF, and uncertainty around the election continued to grow. Is this a cause for concern? Or are we just repeating the cycle of the past?
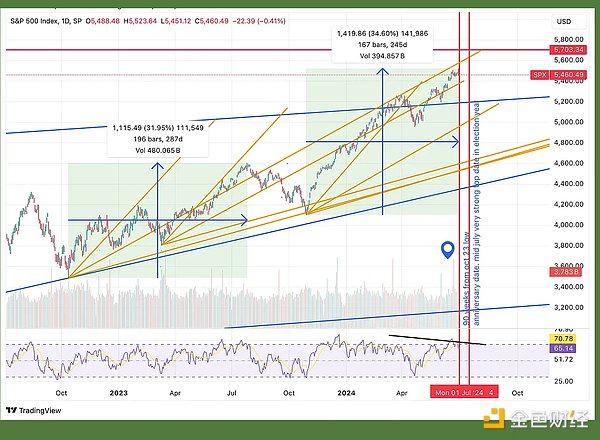
First, I want to share with you our post from July 1st to remind everyone how powerful these knowledge can be when you master them correctly.

The image and text above are from our July 1st outlook, when the SPX was trading at 5,450. Exactly 200 points later, 17 calendar days later, it began to pull back. Read the full article here to see how we used date ranges and price ranges to predict this exact turning point.
If you study hindsight well enough, it becomes foresight. Now let’s look ahead to see what this means.
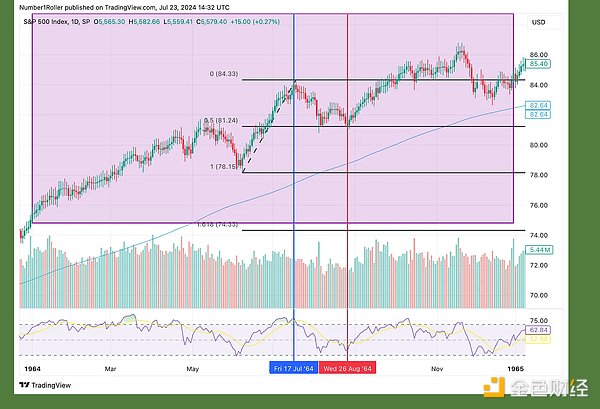
First, looking at the 60-year cycle that Gann called the "Big Cycle," we can see what a powerful influence it has had on this year, as long-time readers will know.

In the chart above, you can see that the summer 1964 top also occurred on July 17th, followed by a 50% retracement into a double bottom on August 26th. Then of course there was the continuation of the bull market. This is exactly the view I am taking in my analysis today. I am not calling for any major tops, I am simply warning that there will be a decline before the trend resumes.
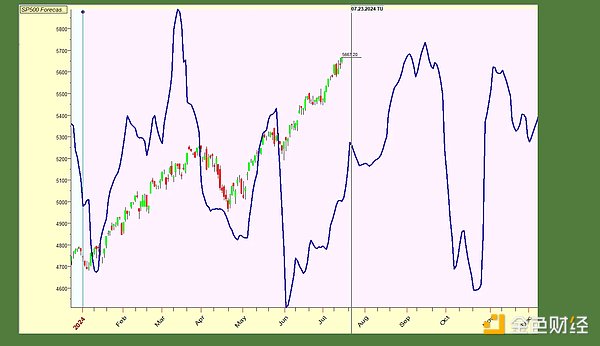
In addition to the SP500 forecast shown below, we can see that the major lows in the 20 and 90 year cycles occurred in this early August window. This year's forecast was pretty accurate and it showed a low in August. Keep in mind that this forecast has nothing to do with the strength of the move, as you can see the chart doesn't match that, but note that it does show the approximate timing of the highs and lows.

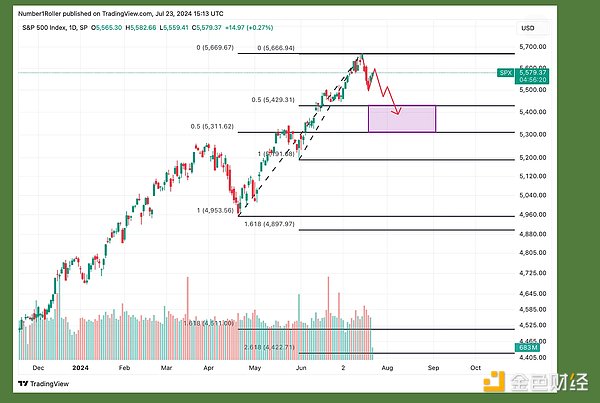
Based on what we've seen in this market, we always look for a 50% retracement on a pullback. That means prices between 5,300 and 5,400, based on the previous two lows.

If stocks pull back, crypto should struggle, right? Not exactly. I think you know my thoughts on August and the coming weeks by now, so I won't rehash the same old stuff. But I do want to analyze the little history we have here about BTC vs. SPX before the election. Here are Bitcoin charts from 2020, 2016, and 2012 with the SPX price action superimposed in black over the exact same time periods. This will help provide more context as they are very correlated at first glance. But on closer inspection you can see that the SPX tends to form lower tops in these images while BTC forms higher bottoms. We then see a point in the run-up to the election where the separation begins as the SPX falls to its final low, while BTC typically begins its parabolic ascent in the October before the election.
Finally, some thoughts on the ETH ETF. First, I don't like the narrative of ETF inflows at all. In my opinion, it has no impact on the cycle. This cycle would have happened with or without ETF inflows. ETFs are just a way for large companies to make more fees by making up new narratives under the guise of "this time it's different because of ETFs" and ultimately sell their positions to unsuspecting retail investors at the end of the day.
That being said, in my experience, this does open the floodgates for more retail buying. From talking to people, I've noticed that older generations who had wealth in brokerage accounts are now more willing and more likely to invest in crypto because they can do so through traditional accounts.

As for ETH's current price action, I'm not worried at all. Everyone in the crypto space and everyone launching this ETF has a vested interest in it. The image above is the current homepage of the Ishares website. If you think BlackRock isn't encouraging its clients to invest in this ETF, then you might want to rethink what you're doing here. The Bitcoin ETF experienced a two-week correction immediately after its ETF was listed. A similar timeline would put us at a low on the major date around August.
 Catherine
 Catherine
 Miyuki
 Miyuki
 Weiliang
 Alex
Alex Miyuki
 Alex
Alex Miyuki
 Weiliang
 Alex
Alex