Author: UkuriaOC, CryptoVizArt, Glassnode; Compiler: Tao Zhu, Golden Finance
Summary
The "Correlation 1" event caused major assets and stocks to fall sharply, and Bitcoin was no exception, recording the largest drop in this cycle.
The price contraction caused the BTC spot price to reach the active investor price, which is $51,400, which is a key level for investor psychology.
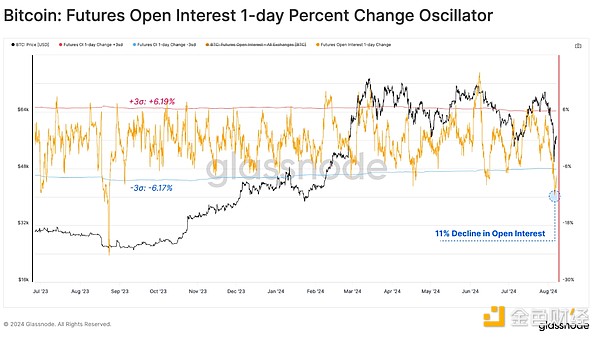
Leverage was also reduced significantly, with futures open interest falling by 11% in a day. This may increase the importance of on-chain data.
Sell-off
Periods of widespread declines in global markets are generally uncommon and usually occur at times of great global pressure, deleveraging, and increased geopolitical risks. On Monday, August 5, stocks and digital assets sold off sharply as the unwinding of the yen carry trade led to market deleveraging, while US Treasuries rallied on recession fears.
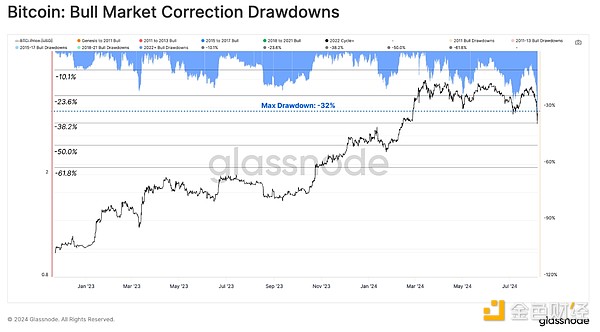
Bitcoin has fallen 32% from its all-time high, the biggest drop in this cycle.
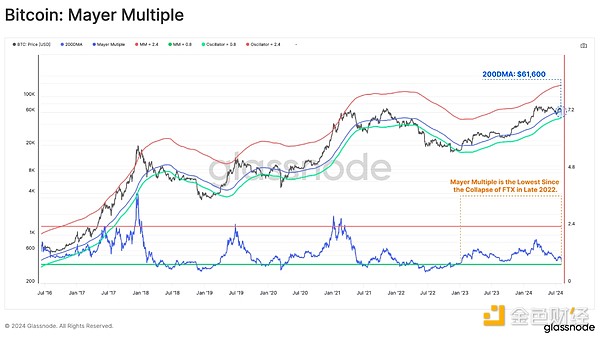
To assess the severity of the price contraction, we can use the well-known Mayer Multiple, which is the ratio between the price and the 200-day moving average. Traders and investors generally consider the 200DMA to be the dividing point between bullish and bearish market conditions.
Currently, the Mayer Multiple is trading at 0.88, which is the lowest value since the FTX crash in late 2022.
Key On-Chain Pricing Levels
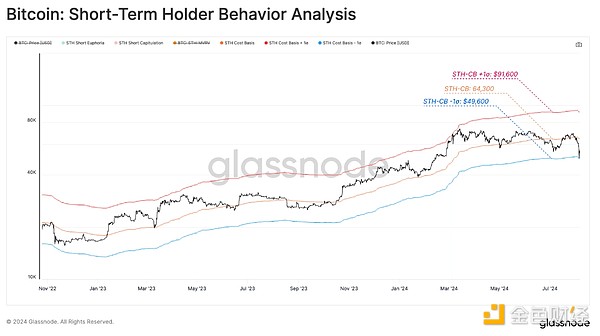
Moving into the on-chain realm, we can assess the severity of the sell-off using the short-term holder cost basis as well as the range representing a -1 standard deviation move. This helps us assess how profitability for new investors changes during price fluctuations.
Short Holder Cost Basis: $64,300 (orange)
Short Holder Cost Basis -1SD: $49,600 (blue)
The spot price fell within the reach of the -1SD pricing range, with only 364 / 5139 (7.1%) trading days of deviation below the pricing level. This highlights the sharp speed of the market's decline.
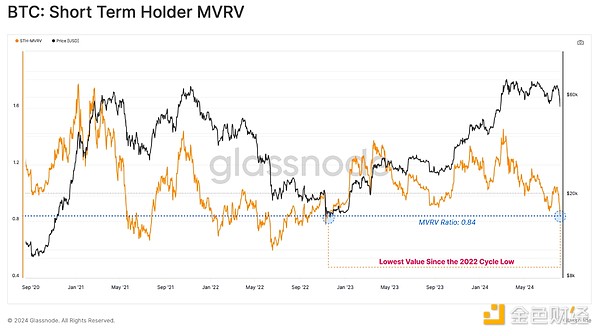
We can also assess these market dynamics through the lens of short-term holder MVRV, which measures the size of unrealized profits or losses for new investor cohorts.
Short-term holders currently hold the largest unrealized losses since the FTX crash, which again highlights the point that current market conditions are severely stressing investors.
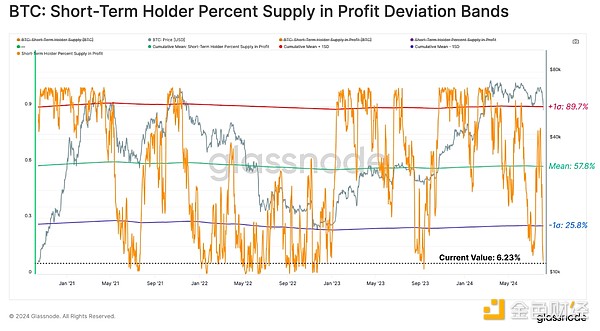
If we evaluate the percentage of profitable supply held by short-term holders, we can see that only 7% of the supply is in profit, similar to the sell-off in August 2023.
This is also more than -1 standard deviation below the long-term average of this indicator, indicating considerable financial pressure on recent buyers.
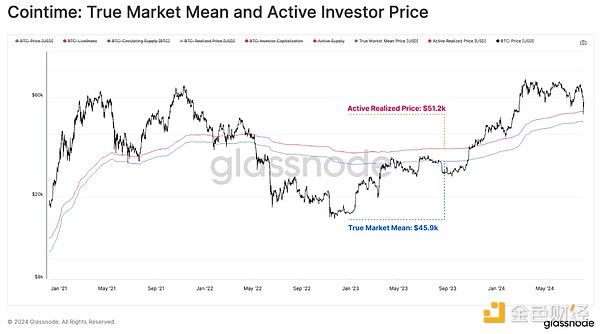
Both the True Market Mean ($45.9K) and the Active Investor Price ($51.2K) provide estimates of the average cost basis for active investors during the current cycle. These models attempt to ignore lost and long dormant tokens.
The location of the spot price relative to these two key pricing levels can be viewed as an area of interest that distinguishes macro bull and bear markets.
Active Investor Price: $51,200 (orange)
True Market Average: $45,900 (blue)
The market did find support around the Active Investor Price, suggesting a group of investors are providing buy-side support close to their long-term cost basis. If the market decisively breaks below these two pricing areas, a major reassessment of the bull market structure would be needed.
Actual losses increased significantly
In the previous section, we assessed the position of the market relative to the level at which investors could experience severe financial stress. The next step is to assess investor reaction by analyzing the size of losses locked in during the event.
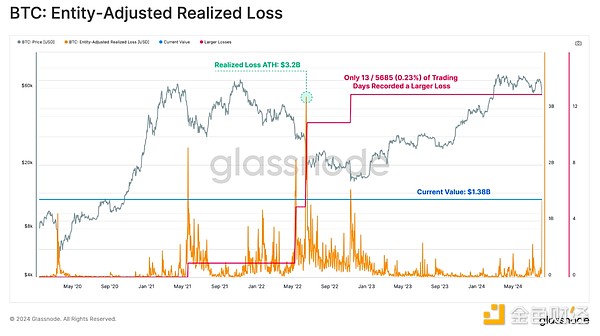
The sell-off triggered investor panic, with actual losses locked in by market participants amounting to approximately $1.38 billion. In absolute terms, this is the 13th largest event in history in terms of U.S. dollars.
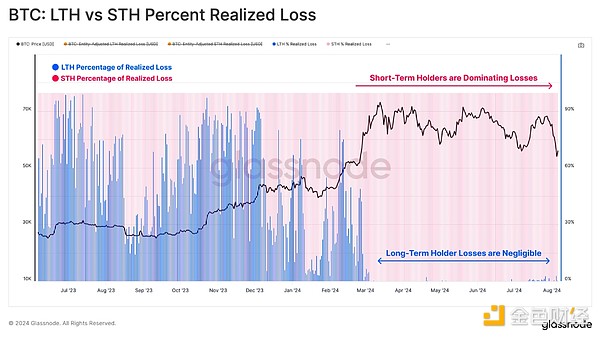
We can break down these losses by long-term or short-term holder groups to determine which groups were most affected. Notably, 97% of the losses can be attributed to short-term holders, while the long-term holder group was relatively calm.
Therefore, we will focus on the short-term holder group as the core of future loss analysis.
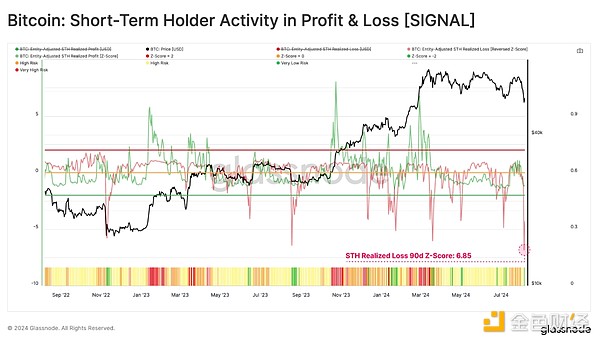
For short-term holders, we note that their realized losses recorded a Z-score of 6.85 standard deviations, with only 32 trading days reaching a larger value. This highlights the severity of the sell-off event in the historical context.
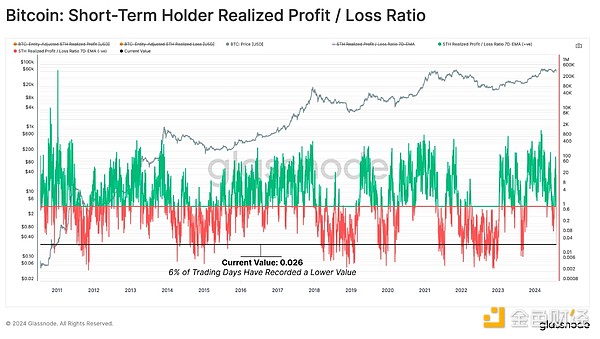
This sentiment was reflected in the STH realized profit and loss ratio, which fell to its lowest value in history, with only 6% of trading days recording lower values.
This shows that the main reaction of investors is panic and fear, as the tokens are sold at much lower than their original acquisition price.
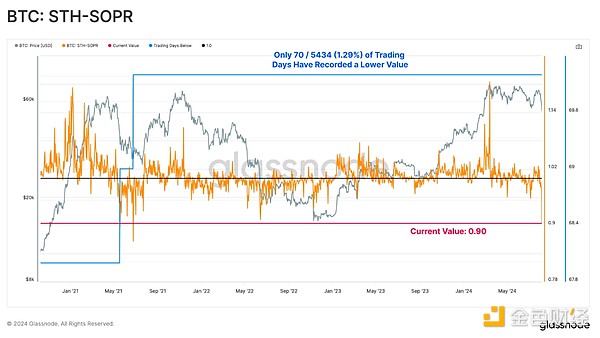
The SOPR for short-term holders also fell to a shocking low, as new investors lost an average of 10%. This illustrates a form of capitulation, with only 70 trading days with a SOPR value below this figure.
Derivatives were liquidated
In the derivatives market, a large number of long positions were forced to close, with a total of $275 million worth of long contracts liquidated. In addition, another $90 million in short positions were liquidated, bringing the total liquidation to $365 million. This shows how many leveraged speculators were cleared out of the market.
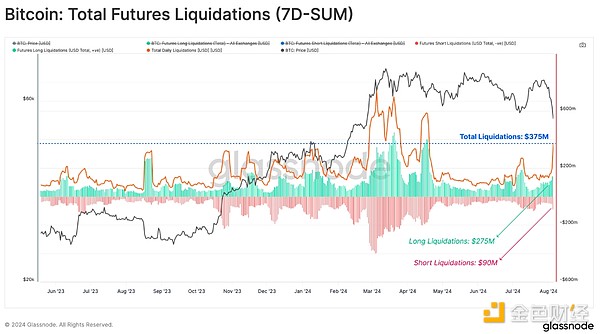
This forced liquidation caused futures open interest to fall by 3 standard deviations, equivalent to an 11% reduction in one day. This could mean a complete reset of the entire futures market and suggests that spot and on-chain data will provide key insights into the recovery process in the coming weeks.
Summary
August has become an exceptionally eventful month for equity and digital asset markets following the “Correlation 1” event that triggered a major market sell-off. Bitcoin fell 32% from its cycle high, hitting a new all-time high and sparked a statistically significant sell-off by short-term holders.
Futures liquidations added fuel to the fire, with over $365 million in contracts forced to liquidate and open interest falling by 3 standard deviations. This led to a significant reduction in leverage and paved the way for on-chain and spot market data that will be critical for analysts assessing the recovery in the coming weeks.
 JinseFinance
 JinseFinance
 CoinMarketCap
 Cointelegraph
 Cointelegraph
 Cointelegraph
 Cointelegraph
 Cointelegraph
 Cointelegraph
 Cointelegraph
 Bitcoinist