Author: Richard Knight Source: medium Translation: Shan Ouba, Golden Finance
A key foundational skill that every cryptocurrency (and stock trader) needs to be very familiar with is the art of reading chart patterns that will help you identify and predict future market movements.
If you are new, this article will help you identify the most common chart patterns, for everyone else, it's a refresher.
1. Head and Shoulders Pattern
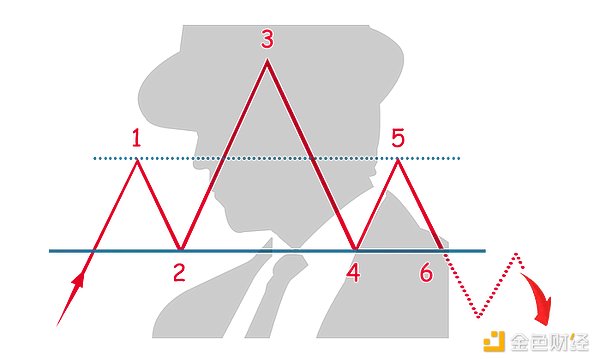
The head and shoulders pattern is a classic reversal pattern that signals a trend change from bullish to bearish or vice versa. It consists of three peaks: the first and third (shoulders) are similar in height, while the middle peak (head) is taller.
The neckline, formed by connecting the troughs between the peaks, acts as a support or resistance line. When the price breaks through this neckline, it indicates that a reversal is underway.
How to use: Traders can take advantage of this pattern by shorting the breakout point of a bearish head and shoulders top pattern, or buying the breakout point of an inverse head and shoulders bottom pattern.
2. Double Top and Double Bottom Patterns
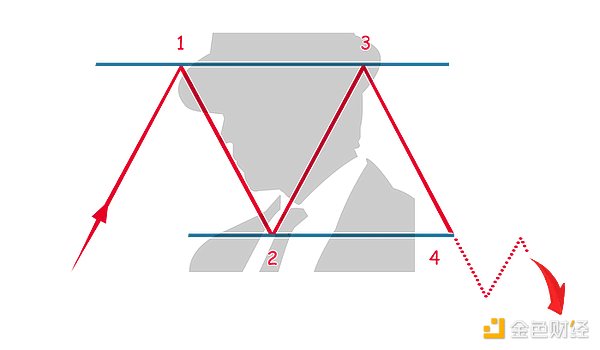
These patterns signal a possible trend reversal, similar to a "W" (double bottom) or an "M" (double top). In a double top, the price rises to a resistance level twice, fails to break through, and then reverses down. A double bottom occurs when price hits support twice, fails to fall further, and then reverses direction and rises.
How to use: Traders can look for these patterns at market extremes. A breakout below the neckline of a double top signals a possible short position, while a breakout above the neckline of a double bottom signals a buying opportunity.
3. Triangles: Ascending, Descending, and Symmetrical
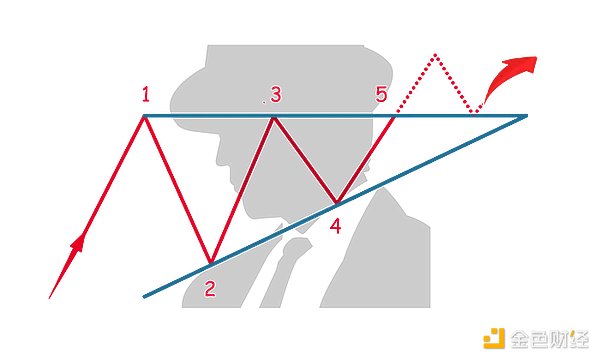
Triangle patterns represent consolidation, which usually leads to a continuation or reversal of the trend. They can take three forms:
Ascending Triangle: When there is a horizontal resistance level and a rising trendline forming. A breakout above the resistance line usually indicates a continuation of the bullish trend.
Descending Triangle: There is a horizontal support level and a descending trendline, and a break below the general descending trendline usually indicates a continuation of the bearish trend.
Symmetrical Triangle: Two converging trendlines indicate a consolidation phase. A breakout in either direction represents a continuation in that direction.
How to Use: Traders can position based on the direction of the breakout, or consider the symmetrical triangle to be a signal that could indicate a trend continuation or reversal.
4. Flags and Pennants
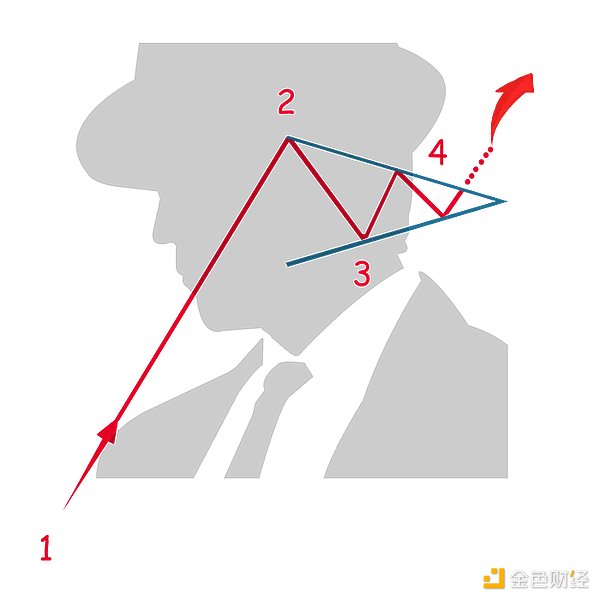
These patterns usually indicate a continuation of the current trend after a brief consolidation period.
Flags: Formed by parallel trendlines in a downward or upward direction, suggesting a temporary reversal to the primary movement.
Small Pennants: Resemble small symmetrical triangles and indicate a brief period of consolidation.
How to Use: When prices break out from a flag or small pennant, traders can orient positions in the direction of the primary trend.
5. Cup and Handle
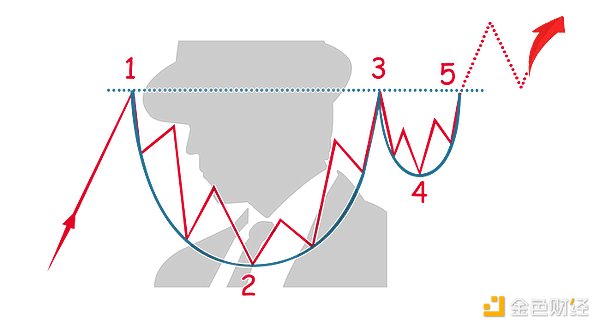
This bullish continuation pattern resembles a teacup, with a round "cup" followed by a smaller "handle". The handle indicates a small-scale consolidation that usually leads to a breakout in the same direction of the initial uptrend.
How to Use: Traders can look for entries above the resistance level of the breakout handle, anticipating a continuation of the prior uptrend.
Conclusion
Understanding your cryptocurrency trading patterns is an invaluable tool for cryptocurrency traders, helping to gain insight into potential reversals or trend continuations. Mastering these five key patterns can greatly enhance your ability to navigate the volatility of the cryptocurrency market. With practice, you will be able to easily identify patterns without hesitation.
Good luck with your trading.
 JinseFinance
 JinseFinance
 JinseFinance
 JinseFinance
 Cointelegraph
 Cointelegraph
 Cointelegraph
 Cointelegraph
 Cointelegraph
 Cointelegraph
 Cointelegraph