Source: On-Chain Mind, Compiled by Shaw Jinse Finance Bitcoin has fallen 12% from its all-time high, prompting widespread online chatter suggesting the bull run may be over. But is this truly the beginning of a crash, or just another typical shakeout in Bitcoin's volatile history? In this article, I'll compare the current market structure to past cycles and identify key levels that will determine whether this correction is benign or something more concerning. Let's get started. Key Points at a Glance Historical Context: Bitcoin's current 12% correction pales in comparison to the 20% to 40% declines that frequently occurred during past bull cycles, suggesting this is a routine fluctuation rather than a trend reversal.
Key Support Levels to Watch: Indicators such as the realized price for short-term holders ($109,000) and moving averages (200-day moving average at $101,000, annual moving average at $93,000) will determine whether the bull trend is sustained.
Investor Mindset Shift: Viewing pullbacks as accumulation opportunities can transform fear into strategy, especially for long-term holders.
No Signs of Capitulation Yet: Indicators such as the realized output profit ratio (SOPR) are showing profits rather than losses, suggesting a sustained bullish structure.
Context Analysis of Bitcoin's Pullback
It has been about two weeks since Bitcoin retreated from its all-time high of $124,000. It's natural to ask: is this just a brief pause, or the beginning of a deeper contraction?
To illustrate this, we can look at the depth chart, which measures the current price's retracement relative to the previous all-time high. In the past year and a half, we have seen five other corrections twice as large as 12%. Compared to at least five other declines of more than 24% in the past year and a half, today's 12% drop is relatively mild. Despite the widespread bearish sentiment online, data shows that Bitcoin has experienced much larger declines before, and more recently. Lessons from Past Cycles It's crucial to compare the current market structure to past cycles. A useful comparison is the 2017 bull market cycle, which also experienced a step-by-step rise culminating in a surge. Here's what happened then: A 20% correction is normal and occurs almost every month during an upward trend. There have been 30% and even 40% pullbacks before the market continued its upward trajectory. In 2017, before reaching the peak (arrow), it experienced multiple sharp corrections of 30-40%. While Bitcoin has grown into a larger, more institutionally recognized asset since 2017, volatility remains an inherent characteristic. In fact, we've already witnessed multiple 20% to 30% pullbacks during this bull run. Would another 30% drop surprise me, then? Not at all. That would bring the price down to around $87,000, a level that, while seemingly subdued, is within historically normal range. From a personal perspective, such a drop could be beneficial for net accumulators like me. Lower prices create opportunities to accumulate more Bitcoin at attractive levels, while rising prices expand overall wealth—both positive things in my opinion. For investors with a five- to ten-year time horizon, these short-term fluctuations are largely inconsequential. When would I turn bearish? A 30% to 40% pullback isn't inherently bearish. History shows that only when declines exceed this level do markets enter a prolonged bear market phase, such as after the 2018 crash. In those cases, a recovery can take two to three years to reach new all-time highs. See below for more details. It can take many years for prices to recover to their previous highs. If you miss the top, you might find yourself holding for the long term.
Currently, the market remains healthy as long as the structural bullish trend remains intact.
Key Price Levels I'm Watching
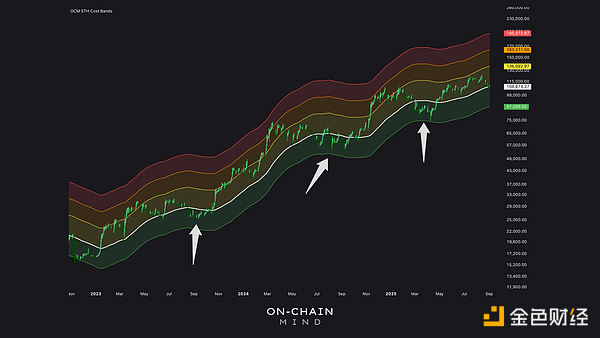
Short-Term Holder Realized Price
The Short-Term Holder (STH) Actual Buy Price measures the average acquisition cost of Bitcoin by recent investors (more specifically, those who purchased Bitcoin within the past five months). It often acts as a psychological support level:
Current STH Realized Price: $109,000.
A drop below this level could cause new investors to lose patience or panic sell. The Deviation Multiple, or my Cost Band, visually shows how far price has deviated from this key level.

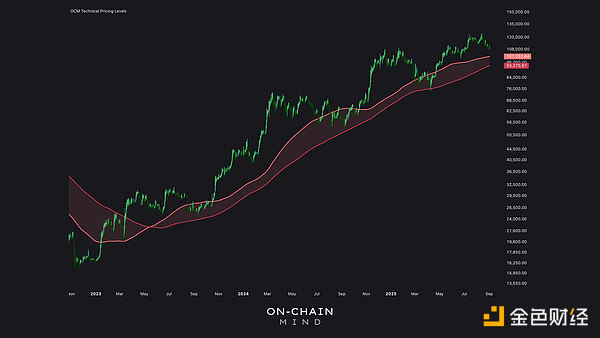
When price has traded within the green Cost Band during this bull market, it has provided us with the best risk reward opportunity of the cycle. The green cost band currently bottoms out at around $87,000 (interestingly, this corresponds to a 30% retracement of the all-time high), marking the highest risk/reward accumulation zone. While the market could linger near this level for months, further upward momentum typically follows the end of the last wave of selling. The 200-day moving average (MA) is a widely followed technical indicator that often represents long-term trend support. The current 200-day MA is $101,000. A price test at this level suggests a pause in the trend, but it doesn't necessarily signal market weakness. In both bull and bear markets, prices like to revisit this level as a test of trend continuation. Statistically, prices tend to revert to the mean in trending markets. Psychologically, this level is a magnet for round numbers (with the nearby $100,000 figure being quite attractive). A break below this level could exacerbate bearish sentiment, but holding it maintains the bullish structure even in sideways trading.
365-Day Moving Average
To me, the annual moving average defines the line between bull and bear markets.
Current 365-day moving average: $93,000.
A breach here would trigger a reassessment of the broader market health, particularly investor spending behavior and herd selling dynamics.

Using SOPR to Evaluate Investor Behavior
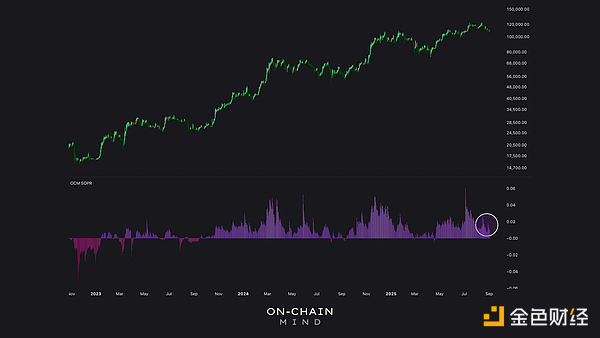
The realized output profit ratio (SOPR) measures the ratio between the token sale price and the purchase price:
SOPR > 1 (purple): tokens are sold at a profit.
SOPR < 1 (pink): The token is being sold at a loss, indicating capitulation.

Even though SOPR is trending down, it is completely in line with our expectations for the current stage of the market.
Currently, SOPR’s 7-day moving average remains positive, suggesting that active investors are making profits rather than losses. A dark pink signal coupled with a test of the 365-day moving average could signal underlying structural weakness in the market.
Current Strategy and Mindset
Holding Bitcoin involves bearing the risk of price volatility.
Bitcoin's history demonstrates that patience is more important than reactivity. Pullbacks of 20% to 40% are common in every cycle. While they may feel severe, they are merely minor blips in the long run. A 12% drop amidst the internet frenzy? That's understandable. While a deeper pullback is always a possibility, rather than fret about it, focus on key price levels: STH realized price: Psychological support at $109,000; 200-day moving average: Trend confirmation at $101,000; 365-day moving average: Bull/bear market dividing line at $93,000. Holding these positions maintains the integrity of the bullish outlook despite fluctuations in market sentiment. Structurally, the bullish trend remains intact, and the overall market structure remains unchanged. Pullbacks are a normal part of an upward trend; the trend is your friend until there's evidence to the contrary.
 Brian
Brian
 Brian
Brian Alex
Alex Kikyo
Kikyo Brian
Brian Brian
Brian Kikyo
Kikyo Alex
Alex Kikyo
Kikyo Brian
Brian Alex
Alex