This is a liquidity-driven bull market, but without traditional liquidity support. The Federal Reserve remains tight, fiscal stimulus is fading, and yet risk assets continue to soar. Why? Because at the top of the economic pyramid, AI-driven capital gains and capital expenditures are being transmitted downward. Simultaneously, crypto treasury companies (TCos) have invented a novel transmission mechanism, reflexively converting stock market enthusiasm into on-chain buying. This flywheel effect should help the market weather seasonal weakness and macro noise until capital spending by hyperscale tech companies slows or ETF buying stalls. My Core Argument (Three Points) 1. The Shift in Liquidity Sources: No longer coming from the Federal Reserve or the Treasury, but from the equity returns and capital expenditures of AI supertech companies. The wealth effect of Nvidia (NVDA) and Microsoft (MSFT), coupled with a wave of capital expenditures exceeding $100 billion, is radiating to the workforce, suppliers, and even retail investors, pushing risk to the bottom of the curve—ultimately, into the crypto market. 2. New "heavyweight buyers" in the crypto market: TCos (MicroStrategy for Bitcoin, Bitmine/other companies for Ethereum) are becoming the bridge between public equity and spot tokens. This represents the missing structural buyer from past cycles. 3. Macro headwinds remain manageable. While data still reveals persistent inflation risks (tariffs, wages, the US dollar) and a weak labor market, AI-driven productivity gains coupled with favorable regulation in the crypto sector are compressing risk premiums. 1) AI at the Top of the Pyramid: Capital Gains → Risk Rotation: With the S&P 500's forward P/E ratio already high, retail investors are beginning to rotate into unprofitable tech stocks, heavily shorted portfolios, and crypto assets. Capital Expenditure as Liquidity: Record investment spending by mega-tech companies acts like a liquidity pump for the private sector—funds flow to suppliers, employees, and shareholders, then back into the market. Side Effects: AI infrastructure development (data centers, chips, electricity) is now reflected in investment growth, which will translate into productivity gains in the future. There is a time lag, but the wealth effect is immediate. 2) TCos = A New Generation of DATs (Digital Asset Treasuries) From "Generation 0" to Active Price Seeking: Early TCOs (such as Saylor's MicroStrategy) were price-insensitive "bottom-buyers." Emerging Ethereum TCOs are active price seekers, defending key price levels and driving breakouts when equity value rises. Reflexive Cycle: Equity financing → Purchase of reserve assets (BTC/ETH) → Token price increases → TCO stock price increases → Funding costs decrease → Repeat. This is the flywheel effect. Achilles' Heel: Gaps exist between key price levels. If ETF or retail buying fails to fill these gaps, a failed breakout will force TCos to conserve cash, leading to a rapid price decline. 3) Policy and Positioning Tailwinds: Relaxed crypto regulations and more friendly policy stances have opened channels for traditional financial capital. Tariff "solutions" are illusive: Businesses remain uncertain about exemptions and legal outcomes related to China, Mexico, Canada, and the USMCA (United States-Mexico-Canada Agreement). This uncertainty is driving companies toward financialization over capital expenditures, with more funds flowing into asset markets.
Ethereum's Current State (and Why the "Reversal")
Treasury demand + ETF flows provide a new narrative for ETH, reversing the years of suppression by L2.
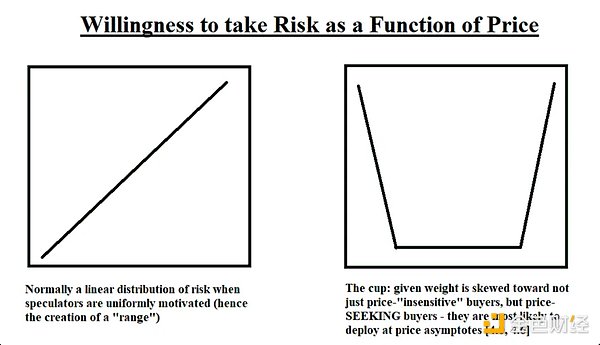
A "Cup Theory" Perspective: Price-chasing ETH TCos hold the $3,000 → $3,300 – $3,500 → $4,000 range; ETFs fill the middle range. If the ~$27 billion in queued demand materializes in phases, the current phase could continue. If not, the hollowing-out effect will be significant. My interpretation: ETH's current buyer structure is completely different from previous cycles. It's no longer a "retail investor vs. miner" battle, but rather a "ETF + TCo" battle against liquidity gaps.
Macro: Walls of Worry (and Why Markets Are Scaled Them)
Inflation
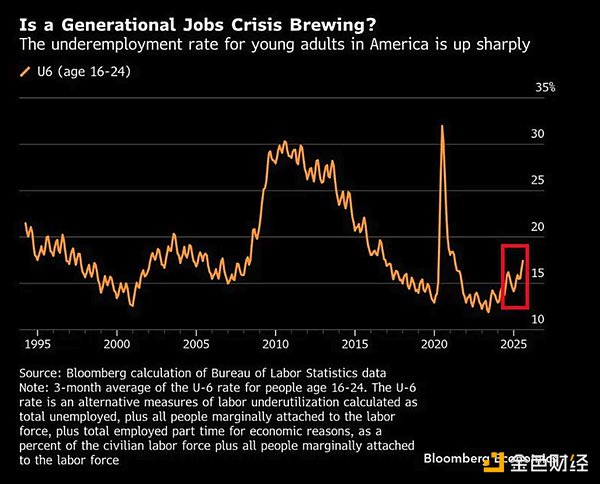
Survey-Based Price Pressures: The Selling Price Index rose for three consecutive months (the highest since August 2022), pointing to commodity-led price pressures, consistent with tariff pass-through, a weaker dollar, and wage stickiness. Interpretation: Implied inflation is approaching ~4%. While not crisis-proof, it will complicate rate cuts. The Fed can only tolerate this "growth-friendly" inflation as long as the labor market remains intact. Labor Force: Surge in Youth Underemployment: The three-month average of the youth underemployment rate is close to ~17%, becoming a "canary in the sand" for the early cycle. Young workers are the first to feel the cyclical turn; if this spreads to core employment groups, market risks will emerge. Growth, Debt, and AI:
Growth, Debt, and AI
AI’s Fiscal Hedging Role: If total factor productivity (TFP) were +50bps above the baseline over the long term, US public debt/GDP could be only ~113% by 2055 (benchmark: 156%), with real GDP per capita ~17% higher. In other words, AI is the only credible growth lever large enough to bend the debt curve.
But there's a lag: Computer investments in the 1980s didn't translate into productivity dividends until the late 1990s, demonstrating that technology dividends take time. Markets are already discounting future efficiency today.
Tariffs and Uncertainty
Policy Fog = Valuation Uncertainty Risk: Unfinalized tariffs, ambiguous agreements (EU/Japan), changes in exemptions, and legal challenges all obscure the forward-looking cost curve. As a result, CFOs are favoring financial assets over long-term physical investments—which ironically supports markets while increasing medium-term inflation risks.
Short vs. Long: My Scorecard
Bearish Factors
TGA (Treasury General Account) consumption + QT (Quantitative Tightening) remain tight.
Seasonal weakness before September.
Initial weakening of the labor market; reacceleration of inflation (tariffs/wages).
Bullish Factors (Reasons to Increase Positions)
AI investment + wealth effect are current sources of liquidity. The shift in crypto policy has unlocked traditional financial funding channels. The TCo/ETF structure has led to sustained mechanical buying. The Fed's dovish stance in 2026 provides a credible forward-looking catalyst. Conclusion: As long as the AI → Retail → TCo → Spot chain remains in place, I remain constructive (bullish). What would change my view? Decline in mega-tech capital spending: AI infrastructure orders have decelerated significantly. Stagnant ETF demand: Continued outflows or failed secondary market offerings. Closure of TCO equity financing: Financing discounts, failed follow-on offerings, or a collapse in premiums to book value. Labor force collapse: Weakness among youth is spreading to core employment groups. Tariff shock → CPI surge: Forcing the Fed to tighten rather than ease.
Cyclic Positioning (Not Investment Advice)
Core: High-quality AI compound growth stocks; selectively allocate to "water seller" targets (computing power, electricity, and network).
Crypto: BTC as Beta, ETH as a reflexive flywheel. Respect key support levels; be wary of "air pockets" in breakouts lacking follow-through.
Risk Management: Manage positions based on ETF flow data, TCO financing schedules, and guidance from large tech companies. Add to positions at support levels; reduce positions when emotional breakouts lack follow-through.
Bottom Line
This cycle is different from the one in 2021.
It is driven by private sector liquidity generated by AI equity returns and capital expenditures, transmitted into the crypto market through new corporate structures (TCo), and then recognized by ETFs.
This flywheel exists and will continue to operate until the "top of the pyramid" (super-large tech companies) shuts down.
Until then, the market's path of least resistance remains "up and to the right."
Macro Pulse Update|August 16, 2025
Covering the following topics:
1. Macro Events of the Week
2. Bitcoin Heat Index
3. Market Overview
4. Key Economic Indicators
5. China Focus
1. Macro Events of the Week
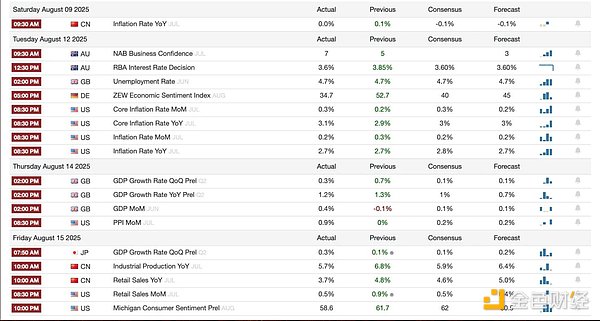
Last Week
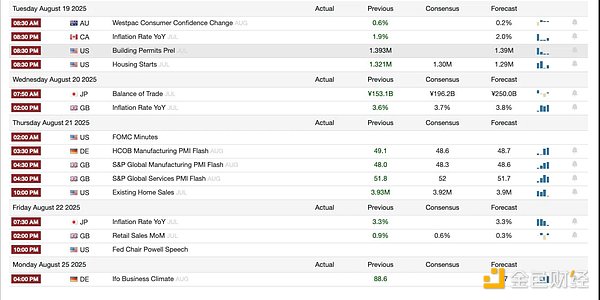
Next week
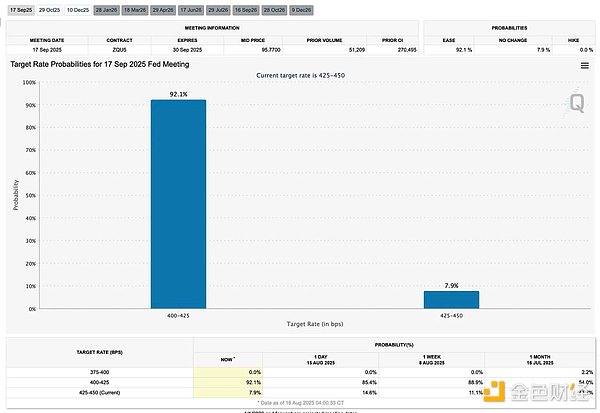
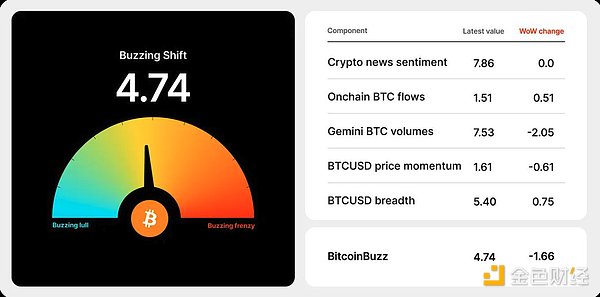
2. Bitcoin popularity indicator
3. Market Overview
Inflation Data and Bitcoin's Reaction: July's CPI came in at 2.7%, in line with expectations, providing initial relief to the market and pushing Bitcoin to a new high above $124,000. However, the PPI's sharp 0.9% month-over-month increase—the largest increase in three years—reminds traders that production costs remain stubbornly high. This tug-of-war between cooling consumer inflation and rising production costs highlights BTC's high sensitivity to macro signals.
Ethereum ETF Institutional Growth: US spot ETH ETFs saw their largest single-day inflow ever, exceeding $1 billion, led by BlackRock and Fidelity. With cumulative inflows exceeding $10.8 billion to date, ETH is gradually gaining institutional asset status—benefiting from regulatory clarity surrounding liquidity staking. This inflow momentum may signal the beginning of Ethereum's own ETF-driven growth cycle, similar to Bitcoin's performance at the beginning of the year. BitMine's Bold Treasury Strategy: BitMine has expanded its equity program to $24.5 billion, signaling its long-term confidence in Ethereum. Its holdings now exceed 1.15 million ETH, making it not only the world's largest publicly listed company's ETH treasury but also a strategic player in shaping ETH's supply dynamics. This concentration raises the question of whether corporate treasuries will impact the liquidity and governance of the Ethereum market in the future. Bullish's IPO Highlights Institutional Demand: Bullish's $1.1 billion IPO saw its stock price surge 143% from its IPO price on its first day, reflecting strong institutional demand for crypto-native infrastructure. Backed by Peter Thiel and Ark Investors, Bullish is positioning itself as a high-profile bridge between traditional markets and digital assets—a sign that investors are eager to pay for platforms that cater to large institutional funds. ALT5 Sigma's $1.5 billion World Liberty token deal and the appointment of Eric Trump to its board of directors highlight another trend: corporate treasuries are exploring a wider range of assets beyond Bitcoin and Ethereum. Whether this is risk diversification or strategic diversification remains to be seen. However, it demonstrates the growing interest in governance tokens and corporate-bound crypto assets. The precedent set by Do Kwon's case: Do Kwon's guilty plea not only marks the end of a high-profile scandal but also sets a precedent. For years, crypto founders have operated in a regulatory gray area. Now, facing a potential 12-year prison sentence, it sends a clear signal that market manipulation and fraud in the crypto space will face the same penalties as in traditional finance.
4. Key Economic Indicators
Generative AI and US Economic Growth
Investment and Productivity: In the first half of 2025, IT equipment investment—much of which is related to generative AI infrastructure—accounted for 59% of real GDP growth. Generative AI is driving spending and valuations, but has yet to translate significantly into broad productivity gains.
Investment Structure Shift: Traditional investment (factories, office buildings, retail) declined, while data warehousing surged, highlighting the dominance of AI. Tariff uncertainty has delayed other capital projects. Market Dynamics: Generative AI is recreating the effects of the dot-com bubble—inflating the stock market, with the "Big Seven" driving most of the S&P 500's gains. If a broader economic slowdown sets in, tech stocks could be sold off to cover other losses. Energy Pressures: By 2030, AI-driven data centers are projected to consume as much electricity as Japan, with US electricity demand growth shifting from data processing to heavy industry. Rising energy costs (and reduced subsidies) could squeeze household budgets and curb consumption. Productivity Lag: Like previous technology waves, AI's long-term dividends will require integration and adaptation. Before boosting productivity, it will reshape the labor market and create winners and losers across industries. Generative AI and U.S. Government Debt: Baseline and Optimistic Productivity Scenario: The Congressional Budget Office projects that, under current assumptions, federal debt will reach 156% of GDP by 2055. If AI accelerates productivity growth, this could fall to 113%, with real GDP per capita 17% higher than the baseline. Greater productivity means faster income growth, lower deficits, and a lighter debt burden. Bond Market Impact: Faster growth could push up yields due to increased capital demand, but efficiency gains could lower inflation. The net effect remains uncertain. AI Productivity Unknowns: Historical experience (computers, the internet) shows a long lag between innovation and productivity gains. The same may be true for generative AI—its fiscal benefits may not be apparent for decades. Immigration as a hedge: Immigration is key to U.S. labor force growth, with foreign workers making up 19% of the workforce. Tightening policies and large-scale deportations (3,000 per day) could reduce the labor force by 1 million workers annually, pushing up wages and inflation while depressing GDP growth and tax revenues.
Dual Path Outlook:
AI-driven productivity boom → stronger growth, lower debt ratios
Immigration restrictions lead to a tighter labor force → slower growth, higher inflation, and wider deficits
Signs of accelerating inflationary pressures
Surveys show rising prices: S&P Global PMI surveys show that US prices for goods and services rose sharply from May to July, reaching their highest level in July since August 2022. This stands in stark contrast to the decline in global price indices – this round of accelerating inflation is unique to the United States. Goods-Driven Inflation: For the past few years, service prices have outpaced goods, but recently, goods have outpaced them—most likely directly related to tariffs. Business Feedback: Companies cited higher import costs due to tariffs, a weaker dollar, and wage increases caused by labor shortages as the primary drivers of rising prices. Implied Inflation Trend: Based on historical comparisons, S&P Global estimates that actual US inflation is running around 4%, consistent with the Yale Budget Lab's forecast that tariffs could push inflation up by an additional 2 percentage points over the next year. The Fed's Dilemma: If inflation continues to rise while employment weakens, the Fed faces a trade-off. History shows that unless the shock is deemed temporary, it prioritizes controlling inflation, even at the expense of employment. 5. Tariff Uncertainty: Despite recent announcements, US trade policy remains unclear, causing businesses to hesitate in their supply chain and investment decisions. Key reasons include: Incomplete Negotiations: Tariff rates on China, Mexico, and Canada have yet to be determined. Uncertainty is heightened with the renegotiation of the USMCA (United States-Mexico-Canada Agreement) next year. Temporary Measures: Many tariffs were implemented without a finalized agreement and remain subject to future renegotiation or exemptions. Businesses and countries are actively lobbying for exemptions.
Ambiguous Commitments: Agreements reached with the EU and Japan include commitments on US investment and energy purchases, but these are non-binding targets, and differences in interpretation have sown the seeds of dispute.
Legal Challenges: Court challenges to the legality of tariffs could lead to a partial reversal, adding another layer of uncertainty.
Exemptions and Lobbying: Industry associations are pressing for exemptions in specific sectors, suggesting the current tariff structure may be temporary.
High Tariff Shock: Over 60 countries currently face tariffs well above 10%, threatening exports and jobs and triggering new rounds of negotiations (e.g., Ireland, Taiwan, and Lesotho).
 Weiliang


