Author: On-Chain Mind, Translated by Shaw Jinse Finance
Behind market fluctuations lies a group of investors who have been manipulating the situation since Bitcoin's inception—long-term holders. Their wallets barely move, their Bitcoins lying dormant for years, and they control when Bitcoin's supply tightens or floods into the market.
Understanding their actions is not only interesting but arguably the most reliable way to predict Bitcoin's next major move.
In this article, we will analyze the role of long-term holders, explore key on-chain indicators that reveal their influence, and emphasize why tracking their movements may be the most reliable signal in today's market.
Key Points
Supply Dominance: Long-term holders control approximately 75% of all Bitcoin, making them the market's true liquidity anchor.
On-Chain Signals: Long-Term Holder (LTH) indicators, such as 30-day net position change, HODL momentum, and flow volume, reveal clear accumulation and distribution cycles.
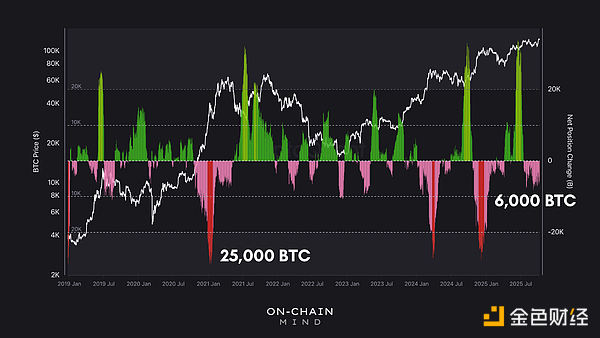
Market Phase: Current data suggests orderly profit-taking rather than a speculative frenzy—implying a market consolidation rather than a topping. Strategy Adjustment: Aligning your strategy with long-term holding behavior can improve risk-adjusted entry points, especially for strategies based on Direct Cost Accounting (DCA). The Most Dominant Players: In the Bitcoin ecosystem, long-term holders (LTHs) are the guardians of Bitcoin's stability. Of the nearly 20 million Bitcoins in existence, approximately 15 million are held in wallets that have not been touched for more than 155 days. This threshold is not arbitrary—it's based on statistical analysis showing that Bitcoin that remains dormant for this period is much less likely to be used or traded in the near future. The remaining 5 million are held by short-term holders. These participants are quick to react, sensitive to price fluctuations, and more likely to sell during periods of market volatility. In contrast, long-term holders act as a stabilizing anchor for the market: their decisions influence supply availability, create a price floor, and indirectly guide market sentiment. Long-term holders (LTH) are often referred to as "smart money," and for good reason. Historically, they: Accumulate aggressively during bear markets, absorbing excess supply. Diversify their holdings during bull market peaks, effectively defining cycle tops. Move in the opposite direction of the crowd, making their behavior a reliable contrarian indicator. A look back at past cycles clearly illustrates this point. During the 2017 peak, LTH’s distribution pushed the market towards a 50/50 split between short-term and long-term holders. By 2021, a similar, though smaller, pattern emerged: the supply held by long-term holders fell to 61% as new participants absorbed the redistributed coins. Two major distribution events have already occurred during the current cycle: the first during the price rally near $70,000 following the ETF listing, and the second during the initial price surge to around $100,000. Each event saw over a million bitcoins transferred from long-term holders to short-term participants—and these large rotations temporarily increased market liquidity. However, with long-term holders still controlling 75% of the supply, we are still far from the supply-demand equilibrium seen at the previous top. This suggests this cycle may have further to run—prices will need to climb further before this group releases more of their holdings. Measuring Long-Term Holder Behavior Understanding the activity of long-term holders requires multiple indicators, each of which provides a different perspective on the dynamics of accumulation and distribution. 1. LTH 30-Day Net Holdings Change This indicator aggregates the daily change in long-term holder balances over 30 consecutive days: A positive value indicates net accumulation, indicating that long-term holders are absorbing supply. A negative value indicates net distribution, meaning that Bitcoin is being released into circulation.

Historically, this indicator has correlated closely with market cycles. During frenetic rallies, the pace of selling by long-term holders (LTH) accelerates - previously reaching 25,000 BTC per day during major peaks. Currently, the selling rate is approximately 6,000 bitcoins per day. This measured selling reflects modest profit-taking rather than a full-blown frenzy, which explains why price action appears subdued despite significant institutional inflows from ETF and Treasury buyers. It's important to note that not all allocations represent a complete exit. Some long-term holders may move their Bitcoin holdings from self-custody into institutional vehicles like exchange-traded funds (ETFs) for increased security, convenience, or tax efficiency. Even small, lifestyle-related withdrawals—the "life chip" effect—could bring Bitcoin back into circulation. 2. HODL Momentum HODL Momentum measures the ratio of short-term holder activity relative to long-term stability, effectively tracking the rate at which Bitcoin is re-entering circulation.
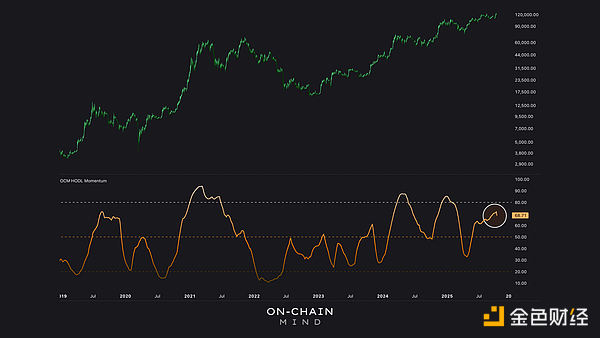
Historically, readings above 80 have marked both local and global peaks.
Currently, the HODL Momentum is around 68, which is high but not yet at extreme levels.

The current oscillatory structure suggests the market is in transition: either cooling off after a round of distribution or gathering momentum for another leg higher. Crucially, this indicator can signal speculative enthusiasm well before price extremes occur, providing a strategic advantage for accumulating or reducing exposure. 3. Long-Term Flow Indicator This is one of the most useful tools for sustained momentum analysis. The Long-Term Flow Indicator tracks the percentage of Bitcoin that has been dormant for more than a year, effectively measuring absorption or selling by long-term participants. A positive (green) reading indicates net allocation—Bitcoin is re-entering the liquid market. A negative (red) reading indicates net accumulation—long-term holders are absorbing supply. This indicator, smoothed with a 50-day moving average and converted into an oscillator, is a momentum-based accumulation/distribution tool that aligns well with traditional volume analysis. It is particularly useful for Direct Amount Investing (DCA) strategies: The red areas indicate increased DCA allocations, buying in tandem with long-term holder accumulation.
Green areas indicate caution or reductions in allocations, as allocations at these times could signal a short-term top.
I like to use this approach to dynamically adjust my investments. Increase allocations during accumulation periods (dark red areas) and reduce or pause allocations during allocation periods (green areas) to improve my risk-adjusted entry strategy.
Currently, this indicator indicates slight net allocation—modest profit-taking rather than a market top, which supports a patient and cautious approach rather than aggressive accumulation.
Examining the Data
Taken together, these indicators reveal a nuanced picture of Bitcoin's current cycle:
The 30-day net position change shows a stable but controlled distribution. HODL momentum has strengthened, but has not yet reached extreme levels of mania. LTH flows suggest light selling, rather than aggressive selling. This suggests the market is neither locally undervalued nor overheated—it's in a transitional phase where long-term holders are quietly adjusting, allowing tensions to build but not yet triggering panic. In my view, the current 75% long-term holder supply level does not signal a cycle top. Long-term holder dominance still has room to decline, suggesting further gains are possible before the kind of massive sell-off that would mark the top of a mania. Moderated profit-taking is healthy—it absorbs inflows without overheating the market. The moderate distribution of long-term holdings, coupled with stable momentum indicators, suggests that the market is gathering momentum for a new rally, not that it is about to top out.
For me, I am slowing down my methodical accumulation pace and using this time to observe rather than react.
 Kikyo
Kikyo


