Bitcoin has enjoyed a strong rally recently, rising to over $68,000. The price rally has catalyzed a surge in perpetual futures trading, and has also provided a big relief to short-term holders, who now have 75% of their Bitcoin holdings in the black.
Summary
Binance, Bybit, and OKX remain the industry leaders in the perpetual futures market, with their contracts accounting for around 84% of total open interest.
In this article, we will introduce a new model that tracks how futures market leverage and open interest fluctuate with the spot price of Bitcoin.
Currently, the price of Bitcoin has recovered above the cost basis of short-term holders.
This is a relief for new investors who have turned 75% of their Bitcoin holdings into profits.
Perpetual Futures Market Turning Point Analysis
The perpetual futures market is the deepest and most liquid trading area for digital assets. Its trading volume is often orders of magnitude higher than the spot market and is the preferred tool for executing trades, speculative positions and arbitrage strategies.
In this article, we will propose a framework for identifying market pivots using perpetual futures markets. It can identify when speculators with excessive leverage will be forced to close their positions during bull market corrections.
In 2024, the open interest of perpetual futures was between 220,000 and 240,000 BTC. This indicator usually drops rapidly during deleveraging events and rises when there are more speculative opportunities. Recently, open interest has risen to the 260,000-280,000 BTC range, indicating a high level of speculative interest in the market since early June.
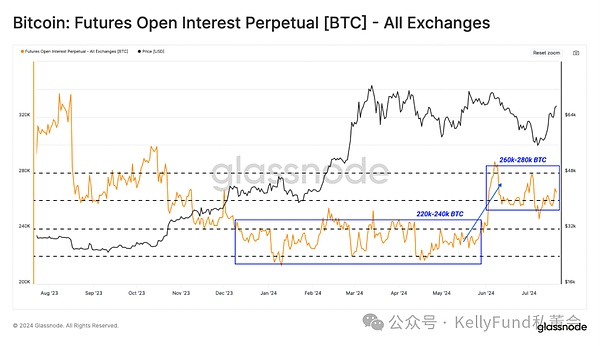
Figure 1: Open Bitcoin Perpetual Contracts Across All Platforms
To better understand the mechanics of the perpetual contract market, we briefly assess the share of the top three exchanges based on open interest.
As shown below, Binance, Bybit, and OKX account for about 84% of the market share, so we will focus on indicators related to these exchanges.
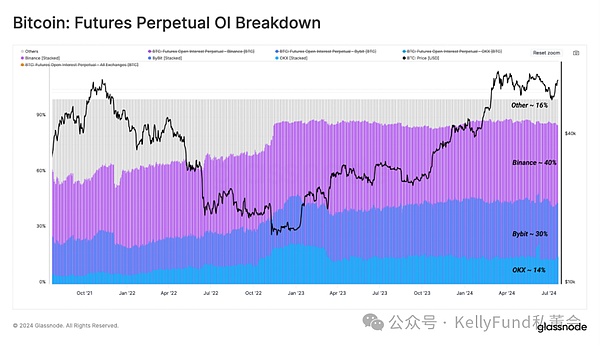
Figure 2: Open Perpetual Futures Contract Details
When the perpetual futures market encounters a turning point, open interest tends to drop significantly. Generally speaking, this is because traders with highly leveraged positions are forced to close their positions.
The figure below highlights the period when the open interest of the top three trading platforms fell by more than 5% in a week. In the past 12 months, we have encountered 10 such perpetual futures liquidation events.
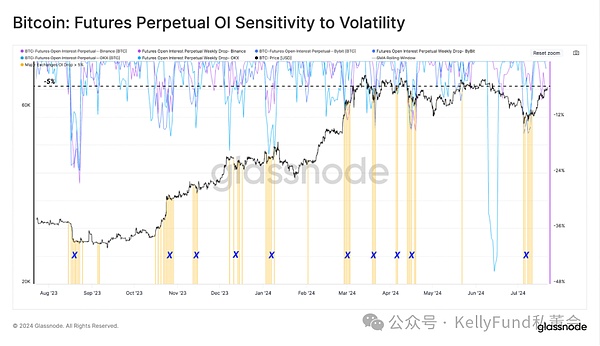
Figure 3: Sensitivity of perpetual futures contracts to market volatility
To assess the size of the contracts that were forced to close, we will analyze the total liquidation volume of contracts across the market during the deleveraging event. The chart below shows that during that period, total liquidation volume (long and short) surged above the typical bull market baseline of $200 million per day.
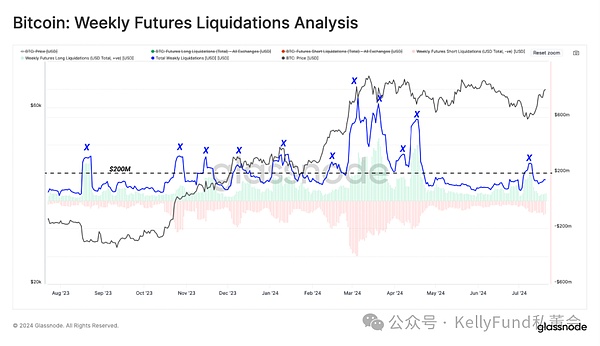
Figure 4: Volume of perpetual contracts liquidated each week
Directional bias analysis of the market
During market turmoil, deleveraging events may occur regardless of whether prices rise or fall. Therefore, we discuss different situations for long and short positions separately:
Long positions dominate liquidations, where more than 50% of liquidated positions are on the long side of the contract.
Short positions dominate liquidations, where more than 50% of liquidated positions are on the short side of the contract.
During the recent sell-off that led to the price drop to $55,000, we saw a clear liquidation turning point. Here, those long positions that were too leveraged were forcibly liquidated, causing the open interest of the three major perpetual futures trading platforms to drop sharply.
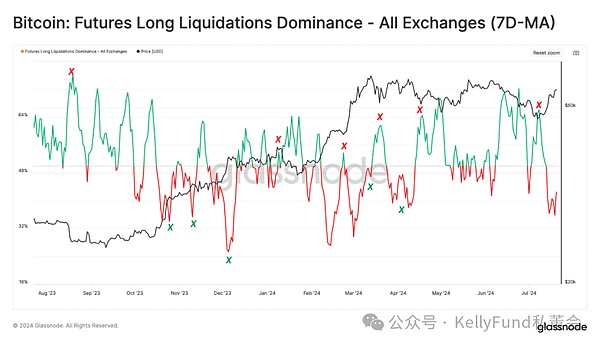
Figure 5: Long-dominated liquidation period transactions (7-day moving average)
Next, we can build a framework to discover these turning points using the perpetual contract funding rate.
This is a very insightful indicator that reveals to us which side of the perpetual contract market the position direction is biased. When the weekly average of the funding rate is above the neutral level (0.01% every 8 hours), it indicates that the takers are strongly bullish on the market.
After Bitcoin price broke through the all-time high of $73,000 in March 2024, the demand for long positions in the perpetual contract market has been weakening. In addition, there was a brief recovery in market sentiment when the price tried to break through $73,000 again in May this year. However, since then, the overall market sentiment has been neutral or even negative.
When the price began to rebound from the $54,000 area, long positions opened with excessive leverage were forcibly closed near the lows. The funding rate below 0.01% shows that there has been no new "long army" rushing to open positions since the lows in July.
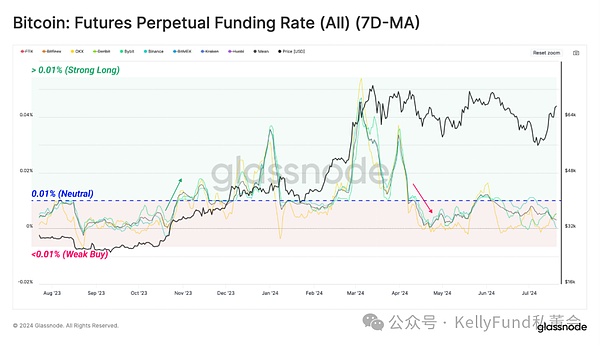
Figure 6: Perpetual Contract Funding Rate (7-day Moving Average)
Profitability Improvement for Short-term Holders
The recent price surge has also provided an immediate relief for short-term holders. At the end of July, more than 90% of the supply from this group was in the red, which caused considerable financial pressure on them.
The rally has now broken through the average cost basis of short-term holders and turned more than 75% of their Bitcoin holdings into profit. We see that their MVRV indicator has now returned to above the break-even level of 1.0.
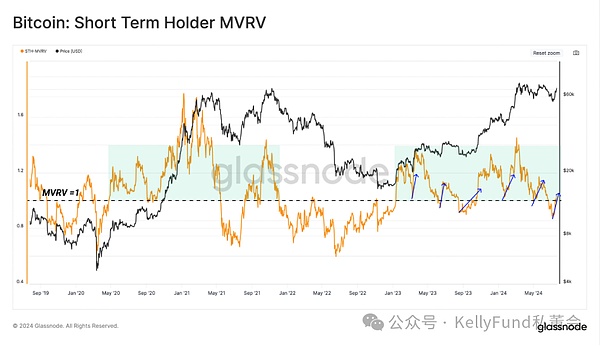
Figure 7: Short-term holders MVRV
Next, we analyze the MVRV indicator of short-term holders with a finer granularity. This is to observe how the profitability of each subgroup of recent buyers changes. The age range we analyzed ranges from recent buyers (1 day to 1 week) to buyers who are about to become long-term holders (3 to 6 months).
1 Day to 1 Week MVRV: 1.05
1 Week to 1 Month MVRV: 1.1
1 Month to 3 Months MVRV: 1.0
3 Months to 6 Months MVRV: 1.07
Profitability has now returned to all short-term holder subgroups, which highlights the current strong uptrend. This is positive for overall investor sentiment.
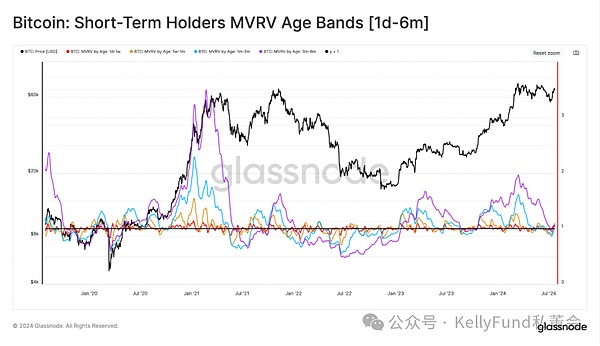
Figure 8: MVRV of different short-term holder groups (1 day-6 months)
Finally, we focus on the net profit and loss of each sub-group - this is an indicator of net capital flow, and this indicator has also shown a significant improvement. Except for the sub-group with a holding period of 1 month to 3 months, the asset flows of other groups are profitable because this group has recently borne the impact of the largest price drop.
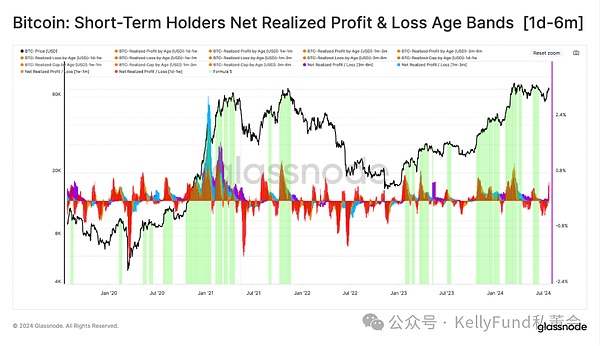
Figure 9: Net Profit and Loss of Short-term Holders with Different Holding Periods
Summary
The perpetual futures market has the highest liquidity and the deepest depth in the entire digital asset market, so its market information is extremely valuable. Because many long traders were forced to close their positions when the price of Bitcoin fell to the $53,000 range, there was a major deleveraging event in the market.
Currently, the price rebound of Bitcoin is also very strong, and most short-term holders have been able to turn losses into profits, which has alleviated their financial crisis. And more good news is still coming one after another-in recent weeks, more capital has been continuously injected into the market.
Article source: https://insights.glassnode.com
Original author: UkuriaOC, CryptoVizArt, Glassnode
Original link: https://insights.glassnode.com/the-week-onchain-week-30-2024/
 JinseFinance
 JinseFinance
 Miyuki
 Huang Bo
 JinseFinance
 Sanya
Sanya JinseFinance
 Clement
 Coinlive
  Finbold
 Cointelegraph