Author: Michael Nadeau, DeFi Report; Compiler: Golden Finance
Tom Lee just proposed a "medium-term" target of $60,000 ETH at Korea Blockchain Week, suggesting that Ethereum is in a 10-15 year super cycle.
If he's right, this will unfold in waves, spanning multiple cycles, with both bull and bear markets.
Currently, we're in a bull market. But it won't last forever
Given that ETH fell 94% in 2018 and 80% in 2022, we should expect another sharp drop. We don't know when this will happen.
But we do know the levels ETH has reached in past cycles relative to several important technical indicators we track.
This week, we share our analysis designed to help you anchor potential outcomes and plan accordingly.
Disclaimer: The opinions expressed are the author's own and should not be relied upon as investment advice.
Let's get started.
Key Technical Indicators Analysis and Price Targets
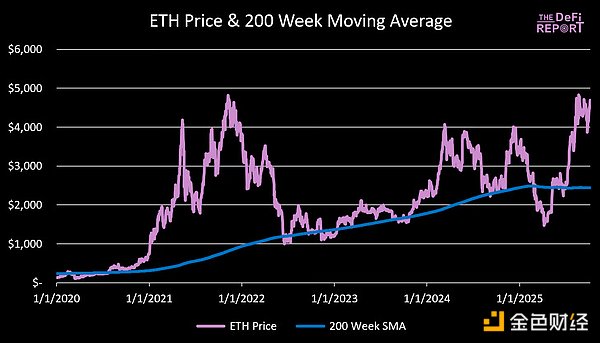
200-week Moving Average

Data Source: The DeFi Report
ETH is currently trading 92% above its 200-week moving average ($2,400).
In the 21-year cycle, the market peaked when ETH traded 492% above its 200-week moving average. Scenario Analysis: · 200% above 200-week moving average: $7,300 · 250% above 200-week moving average: $8,500 · 300% above 200-week moving average: $9,800 · 350% above 200-week moving average: $11,000 · 400% above 200-week moving average: $12,200 The 200-week moving average is a moving target; however, as time passes, we are replacing the price of ETH from about 4 years ago (when it was in the $3,000-4,000 USD range). Therefore, we expect the 200-week moving average to have minimal movement by the end of this year. ETH Price to Realized Price Ratio ETH Price to Realized Price (a proxy for cost basis) has averaged 1.6 since January 1, 2017.
The current ratio is 1.9.
In the 17-year cycle, the ratio peaked at 5.
In the previous cycle, it peaked at 3.5 (April top) and 2.9 (November top). Scenario analysis (assuming we reach a ratio of 2.9): · Realized price $3k = ETH $8,700 · Realized price $3.5k = ETH $10,200 · Realized price $4k = ETH $11,600 Starting on January 1, 2023, the ratio needs to increase by 1, which has already happened twice in the past 3-6 months. MVRV Z-Score

Data Source: The DeFi Report, Glassnode
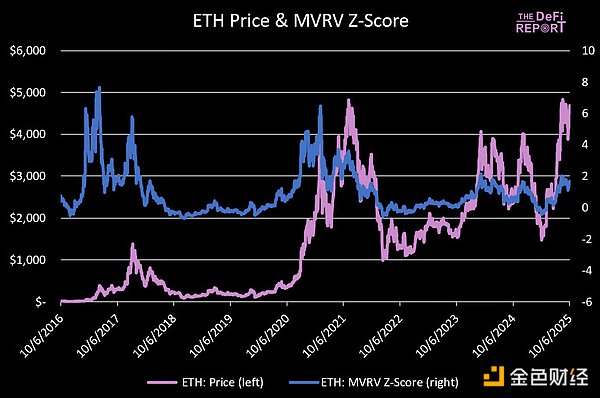
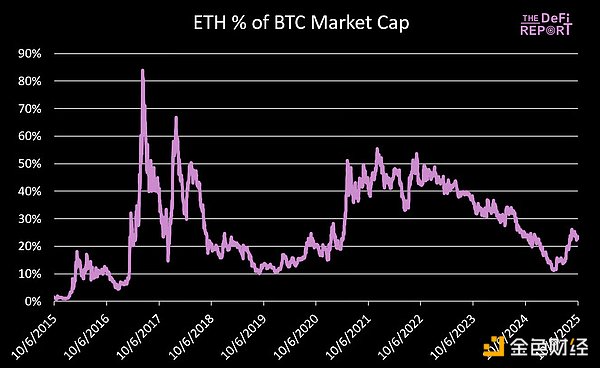
The Z-Score tells us how many "fluctuations" the market cap is above or below its on-chain cost basis. High values indicate statistical overheating. Negative values indicate undervaluation. Since January 1, 2017, ETH's Z-Score has averaged 0.99—indicating a bias toward optimism (market value outpacing realized value). The current value is 1.66 (above the historical average, but not excessively "overheated"). In the previous cycle, it peaked at 6.5 (April top) and 3.48 (November top). Scenario Analysis: · Z-Score is 2.21: ETH $7,000 · Z-Score is 2.77: ETH $8,000 · Z-Score is 3.33: ETH $9,000 · Z-Score is 3.9: ETH $10,000 · h3 style="text-align: left;">ETH vs BTC

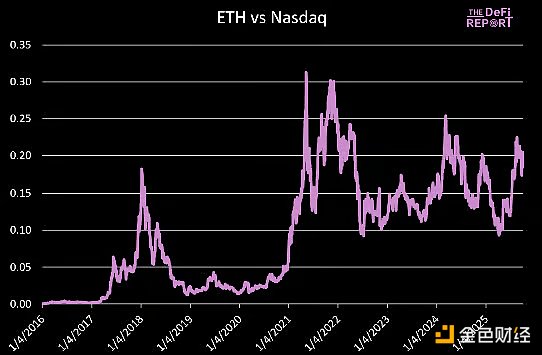
ETH vs Nasdaq

Data source: The DeFi Report
The ETH/Nasdaq ratio peaked at 0.31 in May 21 and peaked at 0.30 in November 21. The current ratio is 0.20, with the Nasdaq trading at 22,788. If it rises 5% by the end of the year (and 23% for the year), that would put the Nasdaq at 23,927. ETH Scenario Analysis: · 0.25 Ratio = $5,981 · 0.30 Ratio = $7,178 · 0.35 Ratio = $8,374 · 0.40 Ratio = $9,570 Our base case is that the upward trend in the ETH/NASDAQ ratio will continue with the new cycle and we will establish a new high in this cycle (above 0.30). Conclusion: Our forecasts for the base case are: ETH trades 250% above its 200-week moving average ($8,500). ETH reaches $3,000 in realized price (ETH $8,700, assuming a 2.9 ratio). ETH reaches 35% of BTC's market capitalization. At $150,000 BTC, this puts ETH at $8,600. ETH establishes a new high relative to the Nasdaq. A 0.35 ratio = ETH $8,300. Bullish scenario: ETH will reach over $10,000. Bearish scenario: BTC's topping trend spreads to ETH, resulting in a mild peak. Meanwhile, as market sentiment heats up, we are seeing more and more comments about "cycle extension" in the market. This reminds me of the "super cycle" theory that became popular at the same stage of the 21-year cycle. As we have said before, our base case remains that the market peaked this quarter.
 Edmund


