Source: Barron's Chinese
Another "golden age" of active management strategies may be coming.
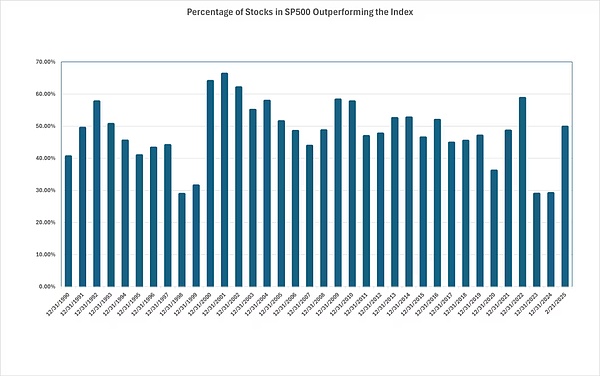
Since the beginning of 2025, the number of stocks that have outperformed the S&P 500 has increased significantly, changing the situation in the previous two years where the stock market gains were highly concentrated in a few stocks, which has brought more opportunities for investors who focus on outperforming the benchmark index.
As of the close of last Friday (February 21), the S&P 500 index has risen 2.4% this year, and 49% of its constituent stocks have risen more than the index this year.
If this situation continues, it will mark the strongest participation rate in the rise since 2022, according to MarketWatch's analysis of FactSet data. So far, this is also a clear difference from the performance of the S&P 500 and its constituent stocks in the past two years.
Less than 30% of the components outperformed in 2023 and 2024, with the best performers being a handful of large-cap stocks such as Nvidia (NVDA), which helped the S&P 500 rise more than 20% for two consecutive years.
The number of components that outperformed the S&P 500 in early 2025 increased significantly
The S&P 500 has never been so heavily dependent on gains by a very small number of components since 1998 and 1999.
The change, along with a rise in the dispersion of individual stock performance that options traders expect, could signal good times for struggling active fund managers, financial professionals say.
“Increasing dispersion is good for active managers,” said Ben McMillan, chief investment officer at IDX Advisors, who believes another “golden age” of active management strategies may be around the corner.
The Cboe Dispersion Index, which measures changes in the expected short-term performance of S&P 500 stocks, has been on an upward trend recently, hitting a three-year high in late January.
Options traders expect more divergence in the performance of S&P 500 stocks over the coming month
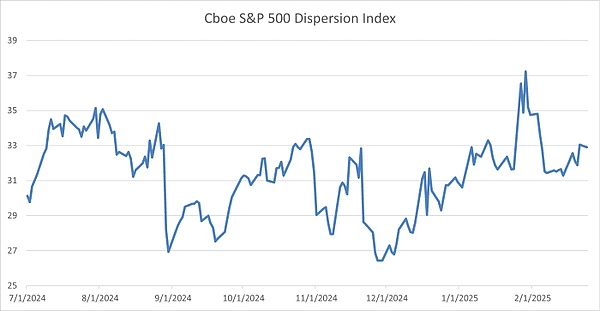
Typically, the Cboe Dispersion Index tends to fall as companies report quarterly earnings, but it has risen in the past few weeks, according to Cboe Global Markets.
There are several reasons for this. One is the quality of corporate earnings, as the number of companies reporting earnings growth began to increase in the fourth quarter, as Wall Street expected, after earnings growth had been highly concentrated in the tech "Big Seven."
Another reason is rising uncertainty about the outlook for U.S. markets and the economy. Investors have questioned the potential risks and rewards of Trump's policy agenda, the wisdom of some companies' large-scale investments in artificial intelligence-related infrastructure, and the underlying strength of the U.S. economy.
"Even against the backdrop of lingering investor concerns about artificial intelligence, tariffs and the economic outlook, individual stock volatility remains very high," said Mandy Xu, head of derivatives market intelligence at the Chicago Board Options Exchange.
Actively managed funds have generally struggled to outperform their benchmarks over time, a phenomenon that has become more pronounced in recent years, according to S&P Dow Jones Indices.
Active managers who hadn’t bet big on the “Big Seven” like Nvidia or other popular momentum stocks like Palantir Technologies (PLTR) and Vistra (VST) over the past two years almost certainly underperformed the S&P 500.
S&P Dow Jones Global Indices regularly publishes aggregate performance data for actively managed funds in the U.S. and other markets, with the most recent update, released in October and covering the first half of 2024, highlighting the challenges stock pickers face in an era of increasing stock market concentration.
“The first half of 2024 could be another challenging period for actively managed funds, especially those focused on U.S. or global equities,” Anu Ganti, head of U.S. index investment strategy at S&P Dow Jones Indices, said in a press release last October.
The gains in expensively valued stocks such as information technology have stalled recently, while cheaper consumer staples, financials and health care stocks have had a strong start to the year, providing backup as most of the Big Seven have struggled.
Still, the 10 largest stocks in the S&P 500, including the Big Seven, still account for more than 37% of the index’s total market value, according to an analysis by ClearBridge Investments.
The S&P 500’s concentration remains very high relative to historical levels
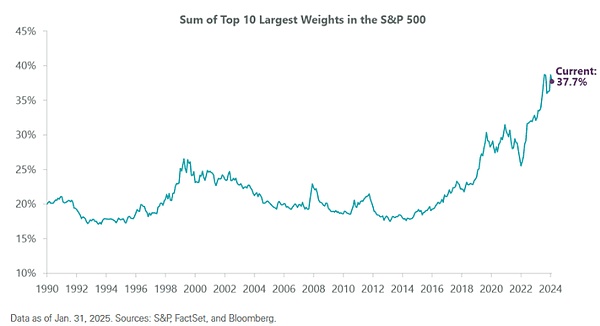
But Jeff Schulze, ClearBridge’s director of economic and market strategy, noted that high concentration has at least declined from its 2024 peak, perhaps suggesting that smaller stocks in the index could continue to outperform.
In the past, when the S&P 500’s concentration passed the 24% threshold, the equal-weighted S&P 500 tended to outperform the market-weighted S&P 500 in subsequent years, Schulze said, and that has been the case 96% of the time since 1989.
This is a relatively small sample size. While the pattern has been in place for a short time this time, it appears to be continuing so far. As of Monday, the Invesco S&P 500 Equal Weight ETF (RSP), which tracks the equally-weighted S&P 500, is up nearly 3% this year, compared with a 2.3% gain for the broader S&P 500.
Other stock markets are also outperforming the U.S., with popular indexes tracking European and Chinese stocks up double digits this year.
As actively managed funds struggle to outperform, more investors are putting more money into cheap index ETFs. The Vanguard S&P 500 ETF (VOO) recently replaced the SPDR S&P 500 ETF Trust (SPY) as the largest U.S.-listed ETF with nearly $632 billion in assets under management.


 Weiliang


