Written by: Shang2046
The information, opinions and judgments on markets, projects, currencies, etc. mentioned in this report are for reference only and do not constitute any investment advice.
BTC is expected to end the longest high-level shock period in history. Patience is the best strategy to welcome the second half of the bull market
Market Week
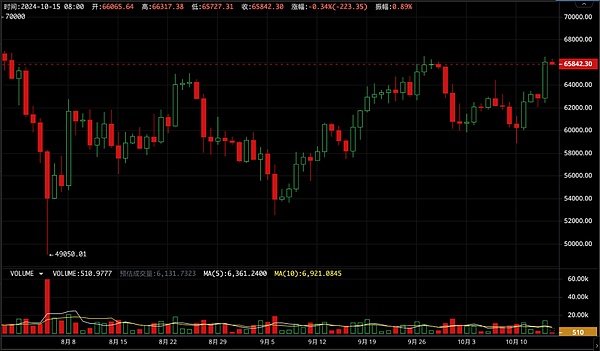
BTC opened at $62,811 this week. As of the morning of October 14, it hovered around $62,500, recording a weekly cross with an amplitude of nearly 9%. On Monday afternoon, BTC quickly rose to around 64,500, and then broke through the 66,000 mark in the evening.
If we ignore the rapid market on Monday, BTC has continued its relatively weak market since October in the past week. This is consistent with the net outflow of funds in the crypto asset world in October. During the same period, the monetary policies of the two superpowers, China and the United States, have undergone tremendous changes, which has also impacted BTC to a certain extent.
On September 23, China issued perhaps the most intensive rescue policy for the stock market and real estate industry in history. The market tends to believe that this is related to the first 50-point interest rate cut in the United States the week before. In the two weeks after China's rescue policy, the United States successively released strong employment data and relatively neutral inflation data. The combination of the two quickly changed the market's expectation of the Federal Reserve's continued 50-point interest rate cut to 25 points, and some institutions even believed that the possibility of no interest rate cut was not ruled out. This has cast a shadow on Bitcoin, which is negatively correlated with the US dollar.
The recent bull market of BTC is highly correlated with the US stock market, especially Nasdaq. In addition, the spot ETF is directly related to the two, and the recent market trend is also highly correlated with the inflow and outflow of ETF funds.
A recent article by BlackRock pointed out that the market tends to compare BTC with US technology companies, but this obviously misunderstands the special asset attributes of BTC. In the medium and long term, the situation of being "engulfed" by the US stock market will definitely be solved.
Looking back to the world of crypto assets, after 7 months of high-level shock adjustments, BTC has established solid support in the current range, and the chips have also been fully washed. Once the second half starts, it will develop rapidly.
Federal Reserve and Economic Data
On October 10, the United States announced that the annual CPI rate was 2.4%, slightly higher than the expected 2.3%. On October 14, the United States announced that the number of new jobs in September was 254,000, higher than the expected 147,000. And the employment data for July and August were significantly revised upward.
The continued expansion of the conflict in the Middle East has also increased the risk of inflation rebound. As Fed officials continue to be hawkish, market parties have finally lowered the rate cut this year. Currently, FedWatch has the highest probability of two rate cuts, 25 basis points each time.
With the decline in the rate cut this year, the US dollar index rebounded strongly, rising to 102.89. At present, market parties are gradually pushing stock indexes up slowly under the expectation of a "soft landing". The Nasdaq is approaching its previous high, and the Dow Jones and S&P 500 have both hit record highs. After the adjustment, gold has stabilized and rebounded. London gold rose 0.17% this week. Treasury bonds were sold off again, with the 2-year yield rising to 3.953 and the 10-year yield rising to 4.073.
Stablecoins and ETFs
This week, funds were outflowing as a whole, with a loss of 330 million US dollars, mainly due to the withdrawal of funds from the USDC channel. Specifically, USDT inflowed 65 million and USDC outflowed 750 million, resulting in a large outflow of 687 million from the stablecoin channel. The ETF channel contributed positive capital inflows: two trading days out of five trading days recorded large inflows, with a net inflow of 357 million for the whole week.
The large outflow of funds on the market was the main reason why BTC broke $60,000 again this week, but the purchase of funds from the ETF channel, supported by the rise of the Nasdaq, enabled BTC to recover to the $63,000 level after falling below $60,000. The rapid breakthrough on Monday was also directly related to the inflow of $470 million from the ETF on the 14th.
Supply Analysis
After a brief "short to long" last week, this week's "long to short" reappeared. Our previous analysis pointed out that the second dispersion of chips after the long-term accumulation of chips is one of the main signs of the start of the second half of the bull market.
The cost line of short-term investors is currently around $62,500, and the maximum chip accumulation price is $61,800. The number of BTC accumulated in exchanges remains low, within 3 million.
BTC on-chain data
There are few changes in new addresses, an increase in Transactions, an increase in active entities and transfer values, and the mid-line has entered an expansion period. Bitcoin mining computing power is running near a record high.
Eco-analysis
The Ethereum ecosystem's active addresses and new address centers have entered an expansion period, and transactions have hit a record high, driven by Layer2 Base.
Solana's new addresses and transactions remain high, the 30-day average hits a new record high, and active addresses remain at a historical high.
Cycle indicators
EMC BTC Cycle Metrics indicators are0.25, and the bull market signal needs to be further activated.


 Weatherly


