Source: WOO Network
August 5, 2024, this day will definitely go down in the history of the currency circle. Bitcoin fell from 58,000 to 48,800 at most, a single-day drop of about 9,000 points, and the maximum drop was 16%, while Ethereum fell even more severely, up to 21%. Other copycat currencies were even more miserable, with the overall cryptocurrency market value falling 14% in 24 hours.
The top market makers have been selling huge amounts of coins one after another, such as Jump, which is currently 96% of its assets are stablecoins; GSR and Wintermute related wallets have also been detected transferring tokens to centralized exchanges.
Not only the cryptocurrency circle was bloodbathed, but the Japanese stock market also suffered an epic crash, with the Nikkei index falling 12% and triggering circuit breakers twice; the South Korean stock market fell about 9%.
The reason for the sharp drop in the global risk market may be related to Japan's interest rate hike and the expected US economic recession.
The impact of Japan's interest rate hike: Because Japan has been under low or even negative interest rates for a long time, the cost of borrowing yen is extremely low. Many traders borrow yen at low interest rates, convert them into US dollars and use them to buy US stocks.
The recent interest rate hike announced by Japan has increased borrowing costs and led to a sharp strengthening of the yen/dollar exchange rate, which means that traders who borrow yen to buy U.S. stocks not only have to pay higher interest on the borrowed yen, but are now facing huge foreign exchange losses. The U.S. dollar assets they hold may not be enough to repay the borrowed yen.
This will lead them to sell their U.S. stock positions to obtain dollars, and to call back yen and repay debts, which will also lead to short-term selling pressure on U.S. stocks.
Expected U.S. recession: The U.S. unemployment rate in July climbed to 4.3% from 4.1% last month, higher than the expected 4.1%, the highest since October 2021, and also triggered concerns about falling into a recession. Goldman Sachs has raised the risk of a recession in the United States in the next year from 15% to 25%.
The market is currently surrounded by negative news. When will this wave of decline end? What level are we in the market now? Can we buy the bottom? Let's follow WOO X research to find out.
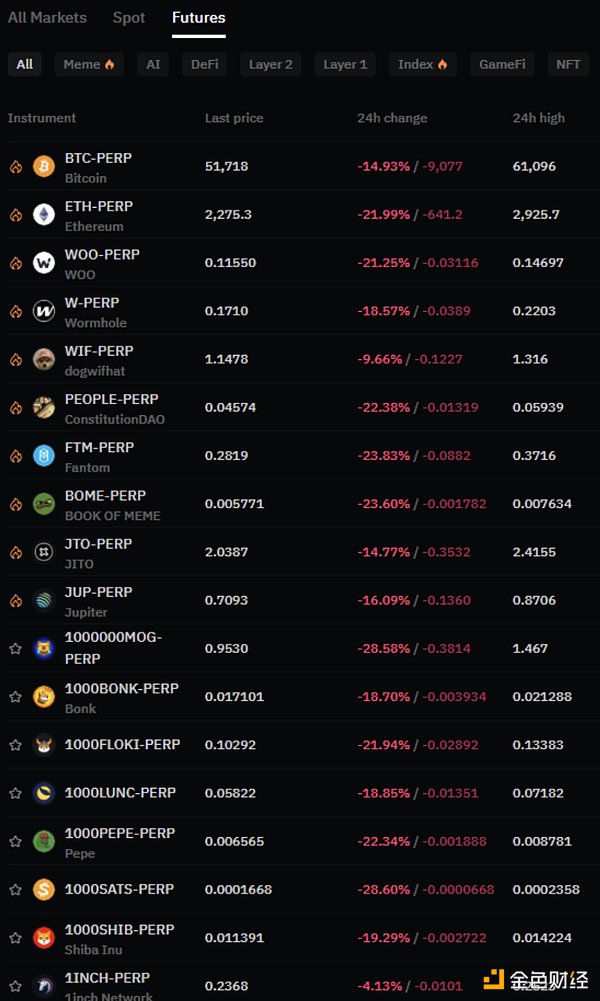
Market sentiment: approaching extreme panic
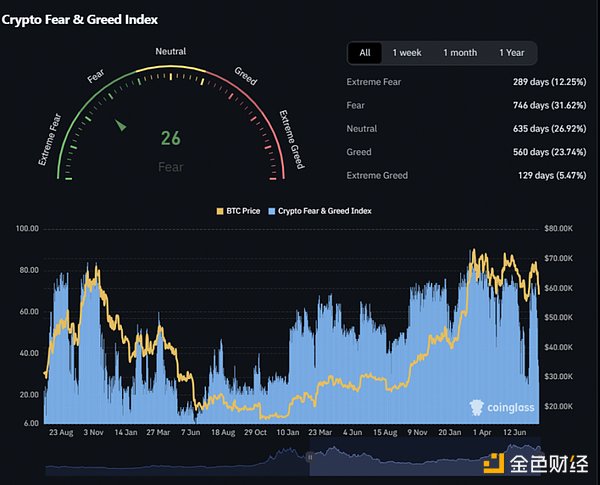
First observe market sentiment. We use the fear and greed index and lending rates to help us understand the current situation of the crypto market.
Fear and Greed Index: A new low in a year and a half
Anti-market sentiment operation: sell when greedy and buy when panicked.
The index is composed of volatility (25%), trading volume (25%), social media voice (15%), market research (15%), Bitcoin market share (10%) and Google search trends (10%). The index ranges from 0 to 100, and the scoring method is as follows:
0-20: Extreme panic
20-40: Panic
40-60: Neutral
60-80: Greed
80-100: Extreme greed
Currently, the index is 74 greedy on July 29 and now 26, in less than a week, it hit a new low in a year and a half, close to extreme panic, indicating that market sentiment changes very quickly, but usually when everyone panics, it may be a good time for us to buy.
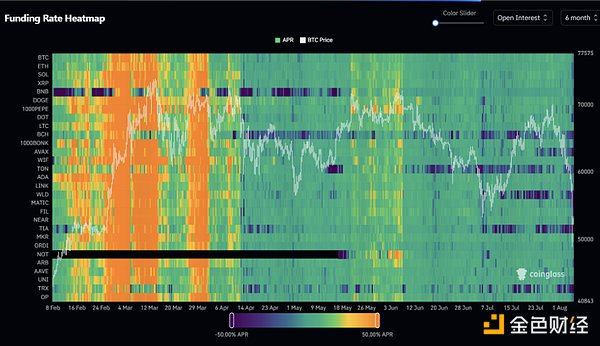
Funding rate: The fees of multiple mainstream currencies are negative
It is established to maintain the balance between the contract price and the price of its underlying asset. This rate is usually applied to perpetual contracts, which facilitates the flow of funds between long and short traders, so that the contract price can be closer to the actual price of the underlying asset.
When the price of a perpetual contract deviates from the price of the underlying asset, the exchange will encourage longs or shorts to pay each other by adjusting the funding rate in the hope that the contract price can return to the price level of the underlying asset.
When the market is bullish, the funding rate is usually positive and increases over time. At this time, longs need to pay the funding rate to shorts.
In contrast, in the case of a bearish market, the funding rate is usually negative, and shorts pay the fees to longs. This mechanism helps to ensure the fairness of contract transactions and the stability of the market.
As can be seen in the figure below, the original funding rate was mostly maintained above 50% APR before 4/12 (longs paid to shorts), the token market sentiment was high, and the bulls were in high spirits. At that time, the coin price was also at a stage high of $70,000.
After 4/12, as Bitcoin fell, the funding rate also returned to neutral, or even negative interest rates, which also means that market sentiment has returned to stability.
In early July, as the price of the currency climbed, the funding rate rose again. In hindsight, it was another staged high point. Currently, the funding rates of many currencies are negative, and the market has returned to a calm and even pessimistic situation.
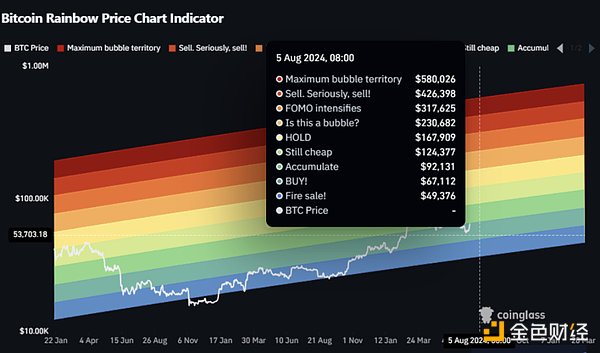
When will it fall? Bitcoin Rainbow Chart Indicator, Al 999 Indicator, and Bubble Index Show Bottom-Picking Range
Bitcoin Rainbow Chart Indicator
The rainbow chart is a tool used to assess the long-term value of Bitcoin. It uses a logarithmic growth curve to predict the possible future price trend of Bitcoin.
The rainbow chart overlays a layer of rainbow ribbons on top of the logarithmic growth curve channel, trying to highlight the market sentiment at each stage when the price crosses the ribbons, thereby identifying potential buying and selling opportunities.
The warmer color areas on the chart show periods when the market may be overheated. Historical data shows that these periods are good times for strategic investors to start taking profits.
When prices fall to colder color areas, overall market sentiment is usually depressed and many investors are less interested in Bitcoin. The rainbow chart points out that these periods are usually excellent times for strategic investors to increase their holdings of Bitcoin.
Currently, the price of Bitcoin falls on the blue band, which is the range of the big auction. In the long run, according to past data, it is an excellent opportunity to buy at the bottom.
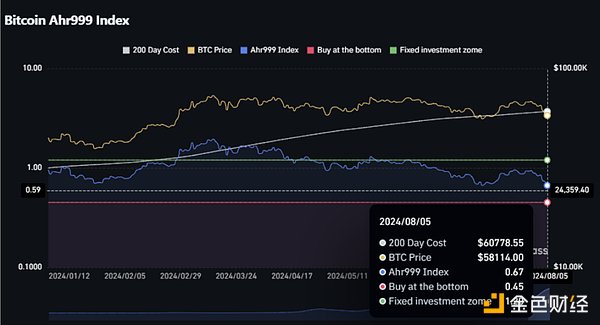
Ahr999 indicator: It falls in the fixed investment range, but the data update is not immediate, or it has reached the bottom line
This indicator implies the rate of return of short-term fixed investment in Bitcoin and the deviation of Bitcoin price from expected valuation.
When the AHR999 index is below 0.45, you can buy at the bottom;
When the AHR999 index is between 0.45 and 1.2, it is suitable for fixed investment;
When the AHR999 index is above 1.2, the coin price is relatively high and not suitable for operation.
In the long run, the price of Bitcoin and the block height show a certain positive correlation. With the advantages of fixed investment, users can control the short-term fixed investment cost so that it is below the Bitcoin price most of the time.
Currently, the Ahr999 index is 0.67, which falls within the fixed investment range of 0.45~1.2, but the current data remains at the Bitcoin price of 58114. At the time of writing, the price was about 52,500 US dollars, which is lower, which means that the Ahr 999 index will be lower than 0.67, which is more suitable for bargain hunting.
Current strategy: Fixed investment is still the best choice
Current market sentiment is low. Affected by a variety of macroeconomic negative events, it is not recommended to operate too aggressively at this time. It is still necessary to observe the current wave of Bitcoin. The lowest point is 48,800. It has now rebounded to about 52,500. It is still necessary to observe whether it can stand firm at 51,500. If it unfortunately falls below, it may return to the 48,000 range, which is also a relatively low-priced buying point.
In addition to observing the trend of currency prices, the attitude of the Federal Reserve is also a major focus. If the interest rate can be cut early or the intensity of the September interest rate cut can be increased, it may bring some hope to the current market.
For readers who want to buy now, it is recommended to start fixed investment (DCA) now. The current market sentiment has almost reached the freezing point, and the current price has a high profit-loss ratio. Don't miss this epic drop in cheap prices through fixed investment. On the other hand, if it continues to fall, you can continue to buy chips at lower prices. From a long-term perspective, now is a good time to invest in Bitcoin.
 JinseFinance
 JinseFinance
 JinseFinance
 JinseFinance
 JinseFinance
 JinseFinance
 Joy
Joy Finbold
 Finbold
 Cointelegraph
 Cointelegraph