Author: Sol, who can't understand Source: X, DtDt 666 Many people attribute this spike in the market to problems with Binance's market makers, including the spike in the gold-backed $PAXG. Why do so many retail investors say that their prices drop when they buy and rise when they sell? So, what do market makers do? How does it work?
1. Transaction fee refund
2. Two-way pending orders, a tiny spread profit after both are executed, accumulating a meager profit, the essence of which is to capture liquidity by using time and information delay
3. Price discovery, helping the market to price efficiently and provide liquidity
4. Market manipulation, selling liquidity to retail investors based on news
The original English name of "market maker" is Market Maker. In other words, where there is no market, market makers make (create) a market.
First, suppose you are the market maker of a project and now have an order book that looks like this:
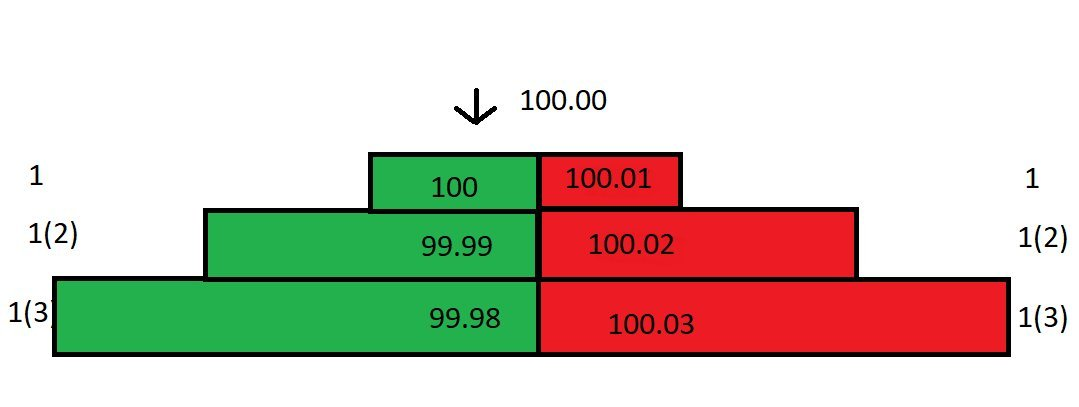
Let's make some assumptions: no other investors are issuing limit orders in this market, you are the only liquidity provider in this market, that is, you are the only market maker; the minimum price change unit is 0.01; all takers need to pay a 0.025% handling fee, and all makers receive a 0.01% rebate. You are the market maker, the one placing the order. You receive a 0.01% rebate on all orders executed at your market price. The difference between the best bid and best offer (bb/o) is called the spread. The current spread in the order book is 0.01. Now, a market sell order comes in, matching your top bid of 100. You pay 100 for this trade, but the other party only receives 100 - 0.025 * 100 = 99.975. Of this 0.025 (100 * 0.025%) is the transaction fee, and you receive a 0.01% rebate, so you actually only paid 99.99. Because the buy order has been removed, the order book structure has changed, and the spread is now 0.02. However, the market price remains at 100, as that was the last traded price: If a buy order comes in at this moment, it will be executed at your ask price of 100.01. You bought at 99.99 in the previous order and sold at 100.01 here, making a profit of 0.02. Adding the rebate, the total profit from this buy and sell is approximately 0.03. Although the spread between your buy one (100) and sell one (100.01) is only 0.01, the actual profit is as high as 0.03! If there are continuous market orders coming in and executing with you, you can make 0.03 for each transaction. If you accumulate this amount, you will be rich in no time! Unfortunately, the market did not develop as smoothly as you expected. After you accepted the goods at 99.99, the spot market price immediately dropped from 100 to 99.80. You immediately cancelled the buy orders at 99.99 and 99.98 to avoid being arbitraged by others. Because the price has fallen to 99.80, your sell price is still 100.01, which is too high. No one will trade with you at this price. Of course, you can adjust the sell price to 99.81, but this will result in a loss of 0.17. Don't forget, you are the only market maker in the market. You can use this advantage to adjust the order book to minimize losses! You calculate the price at which you can place a sell order to break even. You accept the goods at 99.99. To close the order at a break-even price, you need to place the sell price at 99.98 (because after taking into account the rebate, the actual amount you receive is 99.99, which is just enough to break even). So you adjust your order book, placing orders for 99.80 and 99.79 on the buy and sell orders, respectively, and an order for 99.98 on the sell order: Even though the spread is wide, you're the only market maker and can decide not to lower your sell price. If someone is willing to fill your sell order at the sell price of 99.98, everyone is happy. If not, that's fine, because your buy order price has already been lowered to 99.80, a market order will come in to fill yours. At this point, a market buy order comes in and executes against your buy order. Now you hold two contracts, and your holding cost is evenly split: (99.79 + 99.99) / 2 = 99.89. (The previous order was executed at 99.99, and this one is executed at 99.79. The lower price than the buy order is due to our 0.01% commission rebate.) OK, now your average holding cost has dropped to 99.89. You lower your ask price from 99.98 to 99.89. Suddenly, the huge price difference has been halved. You can continue this process, gradually reducing your costs and narrowing the price difference. In the example above, the price only fluctuated by 0.2%. What if the price suddenly fluctuated by 5%, 10%, or even more? Even using the above method, losses can still occur due to the wide price spread! Therefore, market makers need to consider two questions: How volatile is the price in different time windows? What is the market's trading volume? Simply put, volatility refers to the degree to which the price deviates from its mean, and price volatility varies across different time windows. A commodity may fluctuate wildly on a one-minute candlestick chart while remaining stable on a daily chart. Trading volume provides information about liquidity, which influences the spread and execution frequency of pending orders. The above chart illustrates four types of price volatility. Market makers should adopt different approaches to different volatility scenarios: If overall market volatility is low, with both daily and intraday volatility low, you should choose a smaller spread to maximize trading volume. If daily volatility is low but intraday volatility is high (in other words, prices fluctuate significantly but not materially), you can increase the spread and use a larger order size. If the price moves in an unfavorable direction, you can use the aforementioned method of averaging your costs to minimize losses. If daily volatility is high but intraday volatility is low (in other words, prices are moving in a steady trend), you should use a smaller, tighter spread. If both daily and intraday volatility are high, you should widen the spread and use smaller order sizes. This is the most dangerous market situation, often scaring off other market makers. Of course, while this danger exists, it also presents many opportunities. Most of the time, market makers will earn steady profits, but when the market behaves erratically, it can penetrate one side of your order book, forcing you out of the market at a loss. Market making has two key steps: determining the fair price and determining the spread. The first step is to determine the fair price, which is the price at which to place your order. Pricing is the first and most crucial step. If your understanding of the fair price deviates significantly, you may not be able to sell your inventory, ultimately forcing you to close your position at a loss. The first way to determine pricing is to reference the price of the same instrument in other markets. For example, if you're trading USD/JPY in the London market, you could reference its pricing in the New York market. However, if prices fluctuate abnormally in other markets, this pricing method can become highly unreliable. The second method is to use the mid-price: the mid-price = (buy price + ask price) / 2. Using the mid-price is a seemingly simple but highly effective method because the mid-price is the result of market manipulation. Quote around mid, and the market is probably right. Using the mid-price indicates that the market is likely right. In addition to the two pricing methods mentioned above, there are many other pricing methods, such as those based on algorithmic models and market depth, which we won't delve into here. The second issue market makers need to consider is the spread. To determine the appropriate spread, you need to consider a series of questions: What is the average market volume? How much does this volume vary (variance)? What is the average size and variance of take orders? What is the volume of pending orders around the fair price? And so on. Furthermore, you must consider price volatility and variance within a very small time window, the commissions paid/earned by the market maker, and other minor factors such as interface speed and order placement and cancellation speed. Over very short time frames, a market maker's expected profit is actually negative, because every taker order, unless it's a forced stop-loss order, wants to be filled at a price advantage. Every other market participant wants to profit from you. Imagine you are a market maker. Where would you place your order? To maximize the spread, assuming your pending order can be filled, you need to place your order at the front of the order book, at the bid/ask price. Your bid/ask order will be quickly filled as soon as the price changes, but frequent price fluctuations are a disadvantage—for example, if you've just received the goods and the price changes, your original ask/ask order won't be filled at the order price. In an illiquid market with small price fluctuations, placing your order at the bid/ask price is a safe bet. However, this leads to another problem: other market makers may discover your order and place it before you at a tighter spread (tightening the spread). This creates a scramble to narrow the spread until there's no profit left. Now, let's explore how to determine the spread mathematically. Let's start with volatility. We need to determine the volatility of the asset's price/volume around its mean over very short time periods. The following math assumes a normal distribution for price activity, which of course deviates from reality. Assume a sampling period of 1 second, a sample of the past 60 seconds, and assume the mean of the current median price is the same as the mean of the previous 60 seconds (remember, the mean remains constant here), and that there is a 0.04 standard deviation between this mean and the current price. Since we assumed a normal distribution for price movement, we can further conclude that 68% of the time, the price will fluctuate within 1 standard deviation of the mean ($-0.04 - +$0.04); and 99.7% of the time, the price will fluctuate within 3 standard deviations of the mean ($-0.12 - +$0.12). OK, we quote a spread of 0.04 on either side of the mid-price, or a spread of 0.08. 68% of the time, the price will fluctuate within one standard deviation of the mean ($-0.04 - +$0.04). Therefore, for the orders to be filled, the price must fluctuate through either side, exceeding one standard deviation. 32% of the time (1 - 68% = 32%), the price will fluctuate outside this range. Therefore, we can roughly estimate the profit per unit time: 32% * $0.04 = $0.0128. We can continue to deduce: If a price order is placed with a spread of 0.06 (0.03 from the mid-price), corresponding to 0.75 standard deviations (0.03/0.04=0.75), the probability of the price fluctuating by more than 0.75 standard deviations is 45%, and the estimated profit per unit time is 45% * 0.03 = $0.0135. If a price order is placed with a spread of 0.04 (0.02 from the mid-price), corresponding to 0.5 standard deviations (0.02/0.04=0.5), the probability of the price fluctuating by more than 0.5 standard deviations is 61%, and the estimated profit per unit time is 61% * 0.02 = $0.0122. We found that placing an order with a spread of 0.06, or 0.75 standard deviations, yielded the maximum profit of $0.0135! This example shows the spreads of 1, 0.75, and 0.5 standard deviations. Comparing the two, 0.75 standard deviation yielded the highest profit. To further confirm this intuition, I used Excel to derive expected returns for different standard deviations and found that the expected return is a convex function, reaching its maximum precisely around 0.75 standard deviations! The above assumes that price fluctuations follow a normal distribution with a mean of 0, meaning the market's average return is zero. In reality, however, the mean of prices can vary. A shift in the mean makes it harder for orders on one side to be filled. When we have inventory, not only do we lose money, but our expected profit margin also decreases. In short, a market maker's expectation consists of two components: the probability that an order will be filled. For example, an order placed at 1 standard deviation will be filled 32% of the time. The second is the probability that an order will not be filled. For example, at 1 standard deviation, the price will move within the spread 68% of the time, resulting in an unfilled order. When an order cannot be filled, the average price is likely to change. Therefore, market makers need to manage their "inventory cost." This "inventory cost" can be thought of as a loan with interest. Over time, as volatility increases, the interest rate will also increase. Market makers can use the average volatility over various periods to develop a regression strategy to limit their holding costs. Finally, why do many retail investors claim that the price drops when they buy and rises when they sell? This is not unfounded. This article provides the answer!


 Catherine


