Author: Pedro M. Negron, Medium; Compiler: Songxue, Golden Finance
The decentralized finance (DeFi) protocol has pioneered financial services that directly facilitate lending on its platform, allowing users to Lending and borrowing assets without the need for traditional intermediaries. These agreements primarily employ smart contracts, which are automated agreements with their terms embedded directly into the code, providing enhanced transparency and security. Lenders put their assets into liquidity pools and receive interest as compensation, while borrowers can obtain loans by posting collateral. Interest rates are typically set algorithmically, reflecting the supply and demand dynamics of assets in liquidity pools. These agreements include risk management strategies, such as liquidation when the value of collateral falls below a specified level, to protect the lender's assets. This article provides an in-depth analysis of the current development trend of lending protocols in DeFi, exploring the supply and demand, market capitalization, and transaction volume of protocol tokens in the industry.
Supply and Demand
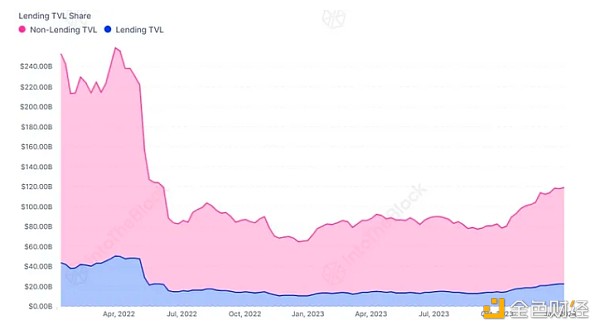
While nearly all protocols saw a significant decline in total value locked (TVL) in 2022, by the end of 2023, TVL was flowing back into lending. This trend may indicate that users are beginning to believe that the bear market has reached its lowest point, thereby reducing the risk of leveraged positions being liquidated. As users become more optimistic about price movements, it is possible to see inflows rise, with users borrowing money to increase their positions.

Source: ITB's Loan Agreement Perspective Dashboard
The loan agreement category has created its own niche , and maintained relative stability compared with the overall market. The TVL ratio of loan protocols has remained stable, accounting for 15-20% of DeFi’s overall TVL. This shows that even in a bear market, there are persistent use cases and demand for lending assets.

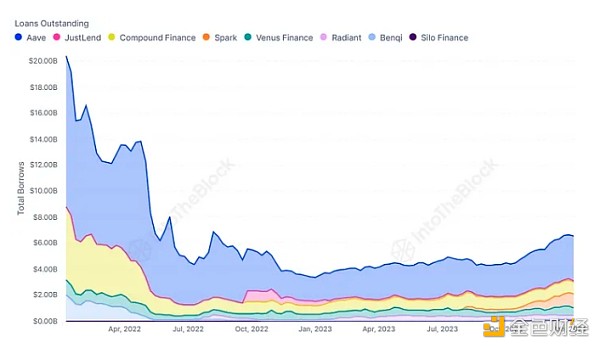
Source: ITB's Loan Agreement Perspective Dashboard
The reduction in TVL in 2022 is partly attributable to users Behavior, users have reduced their desire to borrow assets and trade with leverage due to expectations of a bear market and falling prices. As a result, as lending activity falls, lending rates also fall, prompting depositors to withdraw their funds. Conversely,in a bull market, increased interest in borrowing and leveraged positions pushes lending rates higher, thereby attracting more funds into the protocol. This trend is clearly reflected in the outstanding loans indicator, which has started to rise as market prices and sentiment recover in 2023.
Market capitalization
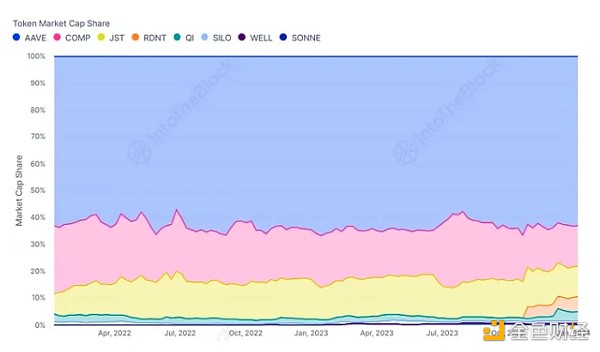
As TVL’s largest protocol, AAVE tokens compete with other lending agents The currency has always maintained its dominant position in terms of market capitalization share. Despite the emergence of new protocols on the market, such as Aave’s fork Radiant, AAVE has maintained a market share of over 60%. Meanwhile, other protocols, such as Compound (COMP) and Justlend (JST), are more susceptible to losing market share as new entrants emerge.

Source: ITB's Loan Agreement Perspective Dashboard
Aave's success is attributed to various features, Users have been taking advantage of the "e-mode" feature recently. This feature designed for efficiency allows users to lend and borrow between similar assets such as ETH and wstETH. This strategy has attracted significant attention to Aave and its forked projects (Spark and Radiant), which attracted significant inflows in the second half of last year.
Protocol revenue is one of the factors that maintains these protocols and is critical to the viability of lending protocols. Aave also stands out in this space, consistently generating over $100,000 in daily revenue. This revenue contributes to the security of the protocol by providing the necessary funds to compensate developers and invest in enhancing protocol security.
Governance Token Trading Volume
Over the past year, the tokens with the highest trading volume were Newer protocols such as Radiant (RDNT) and Sonne (SONNE), while many older coins are still performing well, but newer, less mature protocols with higher transaction volumes are performing worse. This trend is largely attributed to the incentives provided by the two protocols’ native tokens, which are frequently traded by liquidity providers to realize yields. As a result, the RDNT token has been accounting for nearly 40% of the total trading volume of lending protocol tokens over the past year.

Source: ITB's Lending Protocol Perspective Dashboard
These newer coins exhibit larger volatility. Although they have manifested themselves as fairly large short-term price increases over the past year, this has led to some traders buying at the top only to find that their initial investment has depreciated in value. In stark contrast to the high volatility of these newer coins, older coins with larger market caps like AAVE and COMP experience lower levels of volatility.
Overall, the DeFi lending protocol space has shown resilience and innovation, especially through the leading platform Aave. Despite market volatility, Aave has maintained a strong market share through advanced features such as “e-mode” and continued protocol revenue generation. New entrants such as Radiant and Sonne have introduced new dynamics, characterized by high trading volumes and associated volatility. This evolving ecosystem reflects the increasing complexity and diversity of DeFi lending protocols, providing investors and users with a variety of opportunities and risks.
 JinseFinance
 JinseFinance
 JinseFinance
 Bitcoinist
 Coindesk
 decrypt
 Coindesk
 Others
 Bitcoinist
 Bitcoinist
 Cointelegraph