Original: Liu Jiaolian
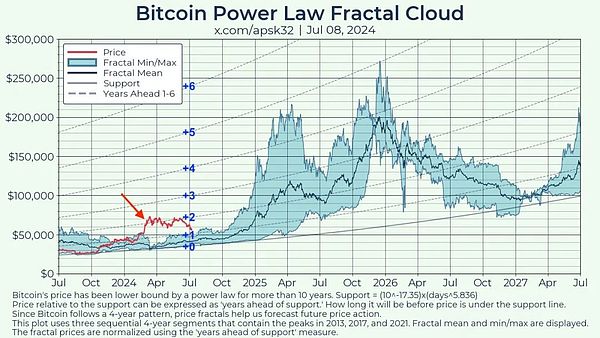
Fed Chairman Powell rarely sings dovish. BTC has been recovering for several days and is currently at 58k. Last night's article summarized the views of many analysis institutions on the market. Among them, Bernstein's prediction is actually a standard number when put into the power law. When commenting on the views of QCP Capital, Jiaolian quoted the power law fractal chart quoted in yesterday's article 《This round of bull market is precocious, March 2024 is a false start, or it will be really started in January 2025》, and estimated the prospects of value gradients S, S+1, and S+2.
Due to the limited space, yesterday's article only talked about that in this cycle, not only was there no discount before and after the halving, but the price also increased, leaving those who were greedy and waiting to buy at the bottom empty-handed.
In fact, if you look more carefully, the time of "crawling close to the bottom" before the halving of this cycle was in October 2023, when BTC almost touched the bottom support of the power law. Then, with the emergence of a series of favorable factors, especially the landing of substantial favorable factors such as spot ETFs, BTC flew away from the support line - the gray-blue arc marked as "+0" by the teaching chain. We record this arc as S. After the ETF was passed in early 2024, it stepped back to the S+1 line - the gray-blue dotted line above S. Then it rushed to the S+2 line in March and oscillated along S+2 until recently, it seemed to fall to S+1 again.
In the figure, the teaching chain marked the arcs S, S+1, S+2, S+3, S+4, S+5, S+6 as +0, +1, +2, +3, +4, +5, +6 respectively.
This series of arcs are all power-law curves. They form a cluster of curves.
What does this thing look like? Yes, a map. Specifically, the (altitude) contour lines in the map.
Geography is movement in space. Finance is movement in time.
The lines +0, +1, +2, +3, +4, +5, +6, etc. marked by the teaching chain in the figure are like the "contour lines" of BTC value movement in the power-law space. Or as mentioned at the beginning, the series of curves S+x are called "value gradients". "Contour lines" should be called "isovalue lines" at this time.
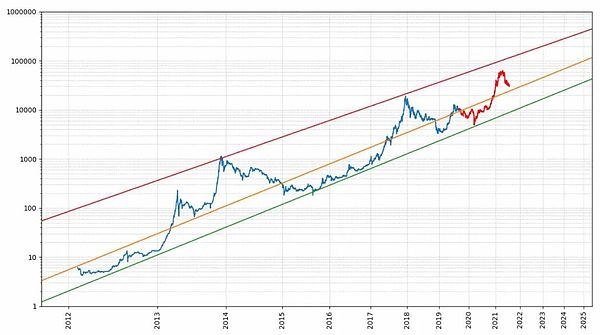
The power law we often see is placed in the double logarithmic coordinate system. In the double logarithmic space, the power law is a straight line. Just like what Jiaolian said 3 years ago As shown in the picture shown in the article "Bitcoin's Price Corridor" on July 24, 2021:
Or, when the power law model first appeared on the reddit forum on September 4, 2018, it looked like this:
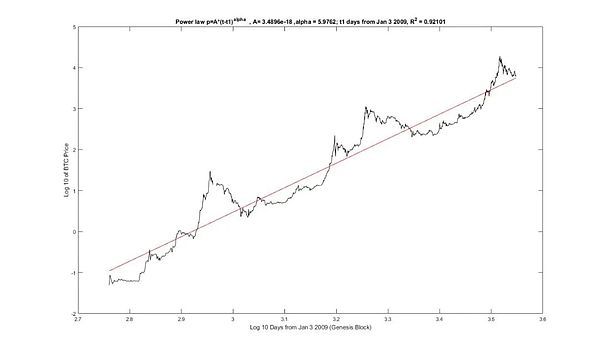
Its mathematical expression (regression median) is:
p = (3.4896 x 10^-18) x days^5.9762
However, the figure marked at the beginning of this article is a Euclidean space, that is, a linear coordinate system, then the power law becomes a curve (arc).
If we use the concept of "contour lines" to understand, then we will see that, for example, $60,000 at the beginning of 2024 is approximately equivalent to $120,000 at the beginning of 2026, because they are both located on the S+2 contour line.
However, we can also understand these "contour lines" from another perspective, that is, their definition, or how they are drawn.
In geography, contour lines are lines connecting points with equal altitudes. Altitude, as the name suggests, is the height from sea level. Obviously, the altitude of sea level is first defined here as 0.
So in finance, or in power law, where is the "sea level"?
We need to do a power law fit and find a support level S, which is the +0 line marked by Jiaolian in the figure. For the graph at the beginning of the article, the analytical expression of the S line is:
S = (10^-17.35)x(days^5.836)
Please note that different people may get slightly different expressions when doing regression fitting of BTC historical prices, which is normal.
Once the S line is found, it is used as the benchmark "sea level" and the "time" - not "height" - points from this benchmark "sea level" are connected to get the "isovalue line". For example, connecting all the points that are 2 years away from the S line will get the S+2 line.
What does this mean? It means that every point on the S+2 line is 2 years away from the S line.
In this sense, these "isoheight lines" or "isovalue lines" of the power law curve cluster can actually be called "isotime lines" or "isochrones".
Understanding this level is very clear. The "isochrone" where you add positions means that after how much time, the S line, that is, the bottom support line, will catch up with the BTC price when you add positions.
If we believe that the S line is the "hard bottom" support level of BTC and it is highly unlikely to be broken, then, in other words, if you add positions on the S line, it is highly unlikely to fall into losses.
Therefore, the meaning of the S+1 line is that if you add positions on the S+1 line, then after 1 year, the S line will catch up with your original increase in position price, and from then on, this increase in position is highly unlikely to fall into losses.
By analogy, the S+2 line means that the increase in position will most likely not lose money after 2 years.
S+3 is approximately equivalent to no more losses after 3 years of adding positions.
S+4 is approximately equivalent to returning to the original long-term win after 4 years.
S+5 is approximately equivalent to a 5-year stable win.
And so on…
A few observations:
(1) Currently, $60,000 is roughly at S+1.5. In other words, if you add $60,000 to your position and survive for a year and a half, you will most likely never lose money again.
(2) If you add more than $90,000, then even if you go through this bull-bear cycle and climb over the hill, you may still be in a floating loss at the bottom of the bear market. In other words, adding to your position in this bull market will not be better than waiting until the bottom of the next bear market to add to your position—but most people don’t have the patience to wait for two years.
(3) Friends who were holding on to the high of $70,000 at the beginning of the year don’t have to worry. $70,000 is just around S+2, which means that as long as you don’t sell at a loss and hold on for two years, you will most likely see hope of recovering your investment or even making a profit.
(4) Historically, BTC has never broken through S+5 even at the peak of the most violent bull market. This means that even if you are waiting for the bull market to take over, as long as you hold on to it, BTC will make you back your money in 5 years! Although you will experience the extreme pain of an 80% reduction in your position, as long as you grit your teeth and get through it, you will be a brave man again in just 5 years. From this point of view, BTC is much kinder than those stocks that often trap people for 10, 15 or even 20 years.
(5) Is it possible that the hard bottom S will be broken? From a historical perspective, it is possible. From a mathematical point of view, of course it is also possible. This is a probability problem! Therefore, the above 4 observations are all about "high probability" rather than "100%". For example, at the end of 2022, the hard bottom S was briefly broken. What should we do when S is broken? Of course, we should buy the bottom! If we buy it at this time, we will make money. Because at this time, it is not S+x but S-x, which is equivalent to "turning back time"!
Conclusion. Back to the question in the title of this article: The most important factor that determines the success or failure of an investment is ().
The answer is: the length of the funds for adding positions.
Or in a more personified way, the life span of the funds for adding positions.
The key reason why many people always lose money is that they always sell at a loss. Why do they always sell at a loss? Maybe it’s because the money he uses to trade in cryptocurrencies is borrowed (or other expenses are misappropriated), and he may have to repay it within 3 months or half a year, or even if he uses a credit card, he will have to repay it next month. With such a short amount of funds, let alone matching S+2 and S+3, even if he is lucky enough to buy on the S line, he may not be able to resist the short-term fluctuations of the market.
I wonder if any readers still remember the article "Don’t be afraid of the selling pressure from governments, this cycle is enough to neutralize it all! " by Jiaolian on July 9th. 》: "Some people are waiting to buy at the bottom and ask when they can add positions. Jiaolian said that for BTC, any time is an opportunity to buy. Don't be greedy and always want to buy at the lowest point accurately. Buy in batches. Hold it for ten years."
Jiaolian's "hold it for ten years" is not just a random remark. The scientific basis behind it is S + 5 < S + 10. S + 10 = S + 5 x 2.
S+10 means crossing two rounds of bull and bear markets. Crossing one round, the return is completed. Crossing two rounds, the pot is full.
As for other factors affecting investment, they are very complicated. External factors basically belong to the category of "victory can be known but not achieved" in "The Art of War". Psychological factors are personal practice. These factors all play a role around the most important core factor of the length of funds mentioned by Jiaolian above.
Of course, there is another important point: the target. It doesn’t mean that it must be BTC, but the target must be like BTC, with the property of power-law growth over time. Otherwise, no matter how much money you have, no matter how long it lasts, it will be swallowed up by the bloody mouth and you will lose everything in the end.


 JinseFinance


