Author: Zack Pokorny, Galaxy; Compiler: Deng Tong, Golden Finance
Abstract
It is now 50 days since the beginning of 2024. We see that the chain The market capitalization of tokenized RWA has reached a record high, the number of addresses participating in some major L1 and L2 DeFi has reached a two-year high, and Ethereum's L2 ecosystem has always remained dynamic. This report highlights some of the major emerging trends in the industry through the lens of on-chain data.
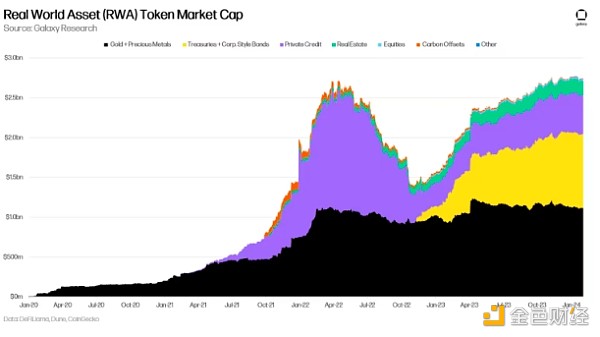
The total market value of RWA tokens hit approximately US$2,774 billion on February 2 All-time highs: The market for tokenized financial assets (i.e. Treasuries and bonds, private credit and real estate) hit a new high of $1,614 billion on February 8. With the RWA token market cap reaching this milestone, the crypto-native asset is gaining market share relative to RWA in key areas of DeFi.
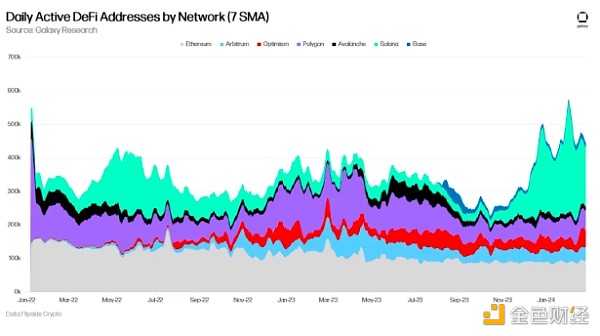
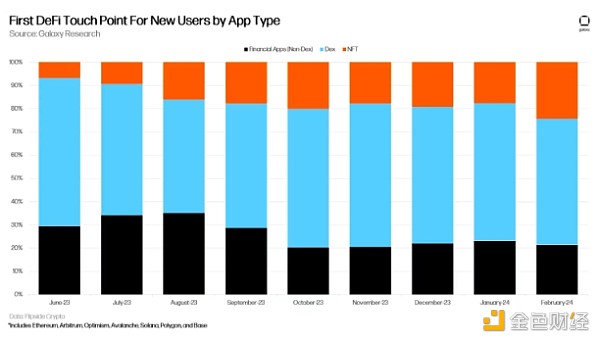
The number of addresses interacting with DeFi in primary L1 and L2 is near a two-year high at 445,000 addresses. Dex is one of the most common types of DeFi applications used when users first use DeFi.
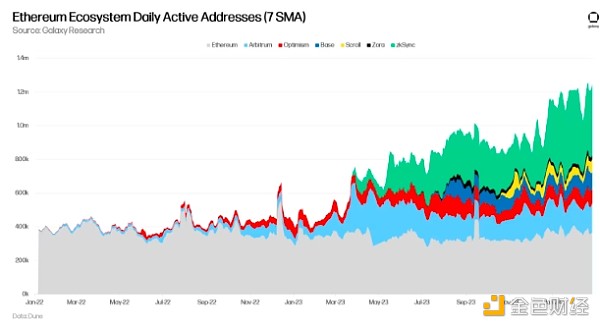
In the Ethereum ecosystem (L1 and main L2), the number of daily active addresses has reached an all-time high, and the number of daily transactions continues to push higher. L2 revenue also saw significant growth last month.
RWA
February 2, 2024 , the market value of tokenized real-world assets hit an all-time high, reaching $2,774 billion. Notably, financial assets including Treasury and other bonds, private credit and real estate hit an all-time high of $1.614 billion on February 8, 2024. Please note that these values only consider the value of the RWA token itself on public blockchains, such as Ondo’s OUSG and Tether’s XAUT, and do not include stablecoins or issuer tokens, such as ONDO and CFG . Financial Assets RWA Treasury Bills/Bonds dominance is at 58.1%, down approximately 110 basis points from the all-time high as of February 26, 2024.
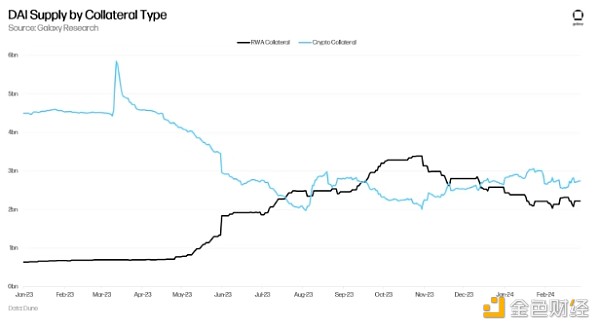
While the on-chain token market capitalization of the RWA token has hit new highs, RWA’s dominance and usage in on-chain products has been declining. This is most evident in the staking of DAI, where RWA usage has been steadily declining since late October 2023. This is a key sign, underscoring the growing preference for crypto-native assets over chains on RWA, and in turn, demand for cryptocurrencies has generally increased. The recent growth of LST-backed stablecoins only adds to this notion and shows that the trend is strong.
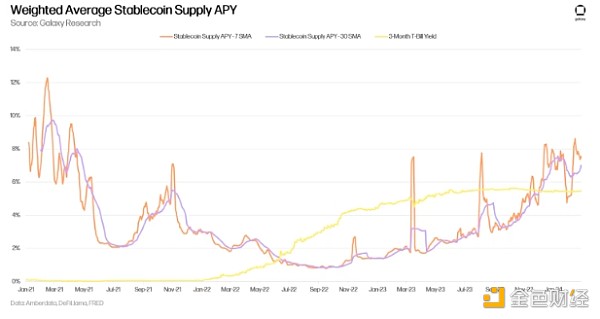
In addition, encryption native Asset productivity has exceeded RWA in several aspects. We covered this in our December 1st newsletter using Maker and DAI as examples, where crypto-backed loans received higher stability fees than RWA. This dynamic remains and is growing again as MakerDAO votes to increase stability fees on some of its on-chain vaults. Most notably, it will increase the fee for minting DAI through its stETH vault by 191 basis points. It is also present in the annualized supply yields of major stablecoins relative to Treasury bill yields. The chart below uses the weighted average supply APY of USDT, USDC, DAI and FRAX borrow amounts in Aave v2/v3 and Compound v2/v3. Since late October/early November 2023 (just before DAI RWA collateral began to decline), stablecoin yields have consistently exceeded the yield on 3-month Treasury bills.
DeFi Users and Retention
According to 7-day SMA data, on February 1, the number of daily active addresses (DAA) using DeFi in major L1 and L2 hit a 2-year high, reaching 576,000 addresses. Solana has remained the most active daily DeFi address, reaching 196,000 as of February 20, 2024, after hitting a high of 330,000 on February 1, 2024 (the day after the Jupiter airdrop). Ethereum, on the other hand, has been losing DeFi users over the past year (down 24% from 120,000 addresses on February 20, 2023). The next section provides more information about Ethereum activity and user numbers.
Dexe has become a user Add the key components of DeFi to the above seven chains. For reference, in the image below, the financial applications category includes applications such as lending platforms and revenue aggregators. Since September 2023, nearly 60% of all new users participating in DeFi on these 7 chains started with DEX. This is consistent with the wave of airdrops and speculation surrounding DeFi over the past six-plus months. Also, note the growing importance of NFTs in attracting new users to DeFi over the past three months.
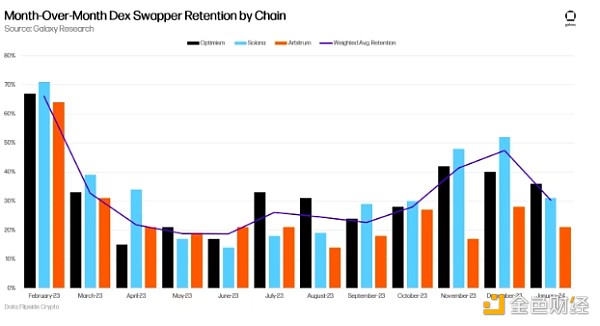
DEX user retention rates were noticeably strong in the three months to January. Solana has the highest DEX user retention rate among the chains observed over the past five months, which can be attributed to Jupiter’s airdrop campaign. The chart below tracks the monthly retention rate of DEX users (the retention rate of users who joined in month more than. Monthly retention rates for these users trended upward for four consecutive months (6 months for Solana) before declining in January 2024. Weighted average retention rate is based on new DEX users per month.
Ethereum and Layer 2
Ethereum has been criticized for declining user numbers and overall activity on crypto Twitter. While it’s true that the number of daily active addresses and activity metrics like transaction count have been flat or even slightly declining for much of the past two years, the promise of a rollup-centric future makes it unreasonable to measure Ethereum solely by L1. Fair. When considering some of the top L2s, user growth and activity are approaching all-time highs.
The chart below shows the total network-wide daily active addresses for Ethereum L1 and some of its leading L2s. As of February 21, the total number of daily active addresses on these networks exceeded 1.2 million, with Ethereum L1 occupying only 360,000 addresses. Note that this chart only includes a subset of all Ethereum L2.
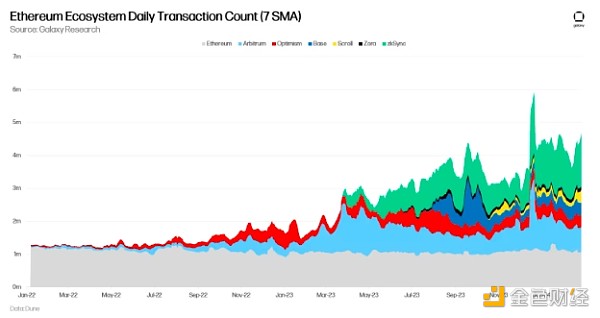
Ethereum is the same as Transaction counts on L2 show similar highs. Despite the slump in Ethereum L1 transactions, its L2 ecosystem averaged 3.14 million transactions per day in the 30 days ending February 26, 2024.
With strong trading In line with the numbers is revenue growth. As of February 26, 2024, Arbitrum, Optimism, Base, Scroll, Zora, and zkSync were generating $1.5 million in revenue per day using 7-day SMA (these are the fees users pay to aggregate sorters). February 26, 2024 also marked the second-highest observed daily combined revenue date for the chain.
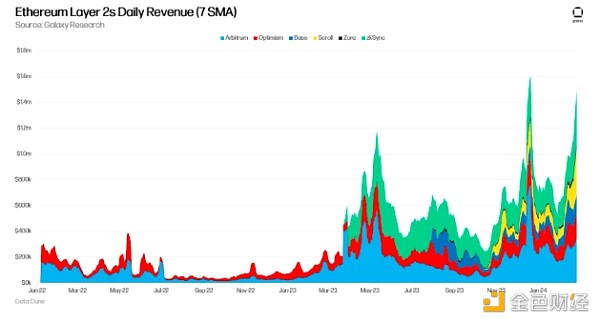
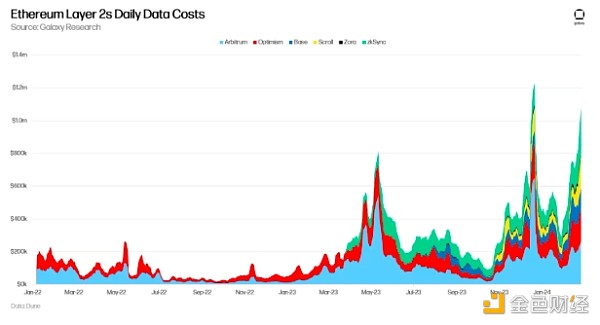
As of 2024 These L2s also paid more than $21.6 million in data costs to Ethereum L1 in the 30 days on February 26. This number will become increasingly important as activity previously performed on Ethereum L1 is performed on rollups.
Summary
Here are some key signals provided by the data above:
Demand for crypto-native assets to replace RWA in DeFi continues.
Despite the end of the massive airdrop, users continued to flock to DeFi, but DEX retention rates declined in January. This indicates some exodus or capitulation among users in this area of DeFi.
While Ethereum’s activity and user numbers have been noted to have declined, its L2 ecosystem remains vibrant, with transaction numbers approaching all-time highs.
 JinseFinance


