Today I will share with you a strategy that can make a lot of money while avoiding losing everything: the dumbbell strategy.
The performance of the following crypto assets was analyzed through indicators:
BTC is always the king: BTC.D Index
ETH lags behind BTC in this stage: ETH/BTC exchange rate
Altcoins are generally sluggish: (1) Altseason Index (2) Altcoin market capitalization
Meme coins have high risk and high returns, outperforming BTC and ETH: Memecoin Index
What is the dumbbell strategy?
The dumbbell strategy is mentioned by Taleb in "Antifragile", which is to adopt a conservative strategy in one field and an open strategy in another field, and abandon the middle route. Simply put, it is "mostly conservative, a small part of radical".
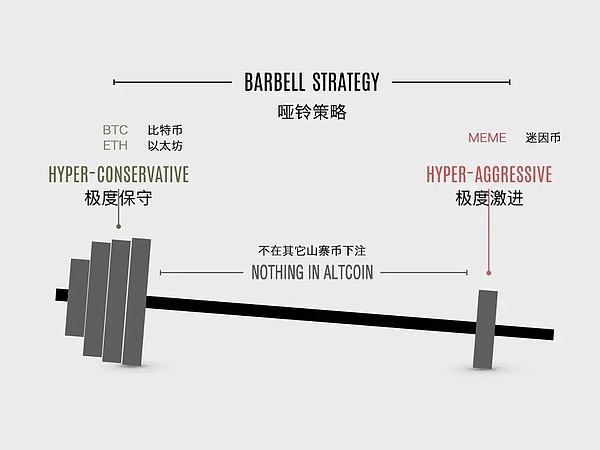
Applied in the currency circle, most of the assets can be invested in assets with relatively good security such as BTC and ETH, a small part of the funds can be invested in high-risk assets such as Meme coins, and most of the altcoins in the middle can be involved as little as possible.
This can not only maintain stability in the high volatility of the currency circle, but also have the opportunity to obtain high returns through high-risk assets (such as Meme coins).
Next, through some indicators, let's objectively look at the performance of BTC, ETH, most altcoins, and Meme coins.
BTC is always the king: refer to the BTC.D index (Bitcoin Dominance)
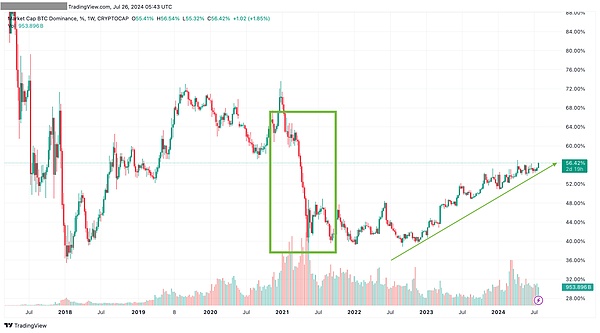
The Bitcoin Dominance Index is used to reflect the market capitalization share of Bitcoin and is often used to determine whether the altcoin season has begun. It can be seen from the figure that during the altcoin season in 2021, the last bull market, the BTC.D index was falling significantly.
The logic that can be explained is: BTC.D index fell ➡️ BTC dominance declined ➡️ Risk increased ➡️ Altcoins regained market position ➡️ Altcoins began to surge. (Vice versa)
We are still in the Bitcoin season. The index has been rising since the beginning of this year. As of July 26, 56%, the performance of altcoins is still not as good as Bitcoin, so Bitcoin is dominant.
ETH lags behind BTC in this stage: Refer to the ETH/BTC exchange rate
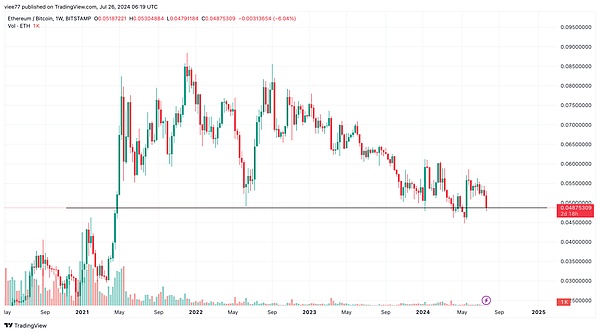
Generally, the larger the ETH/BTC exchange rate, the smaller the price gap between the two, and ETH performs strongly. On the contrary, the smaller the ratio, the greater the price gap, and ETH is weaker.
In addition, this indicator is also used to judge the market's interest in altcoins. If the ratio starts to outperform BTC, it may be a sign that funds are flowing into altcoins.
The current ETH/BTC exchange rate is still at a relatively low level, and ETH is performing relatively weakly. Even the passage of the ETF has not allowed Ethereum to reverse the trend. However, due to the low level, if you are confident in ETH, you can also consider building positions in batches and wait for subsequent increases.
Overall sluggishness of altcoins: Reference (1) Altseason Index
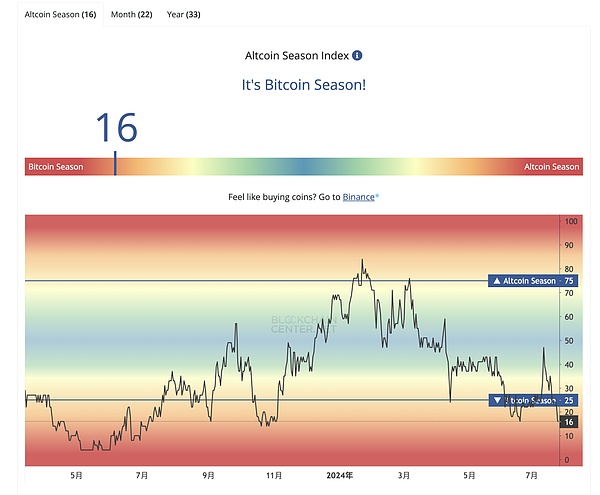
The Altseason Index tracks the sentiment of the altcoin market, and counts the proportion of the top 50 altcoins that outperformed Bitcoin over a period of time. The index shows that it is an altcoin season when it is greater than 75, and it is a Bitcoin season when it is less than 25.
It is obvious that we are currently in the Bitcoin season, with the index at 16, and the momentum of altcoins is relatively weak. This year, the index was only greater than 75 at the end of January, and it only lasted for half a month. Compared with the three months from the end of March to the end of June 21 when the index exceeded 75, it is not a true altcoin season.
The overall sluggishness of altcoins: Reference (2) Total market value of altcoins
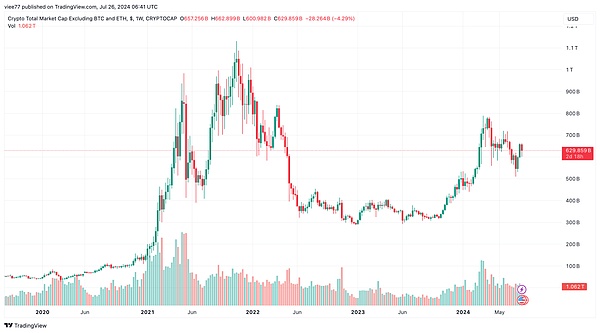
The full name of this indicator is Crypto Total Market Cap Excluding BTC & ETH. In addition to BTC and ETH, the total market value of other tokens in the crypto market reflects the overall situation of funds flowing into the altcoin market.
After a significant increase in the beginning of the year, the total market value of altcoins did not continue to maintain the trend. In the past few months, it has fluctuated repeatedly in the volatile market. There is no obvious breakthrough signal at present. The overall altcoin market is still relatively weak.
Meme coin has high risk and high return, outperforming BTC and ETH: refer to Memecoin Index
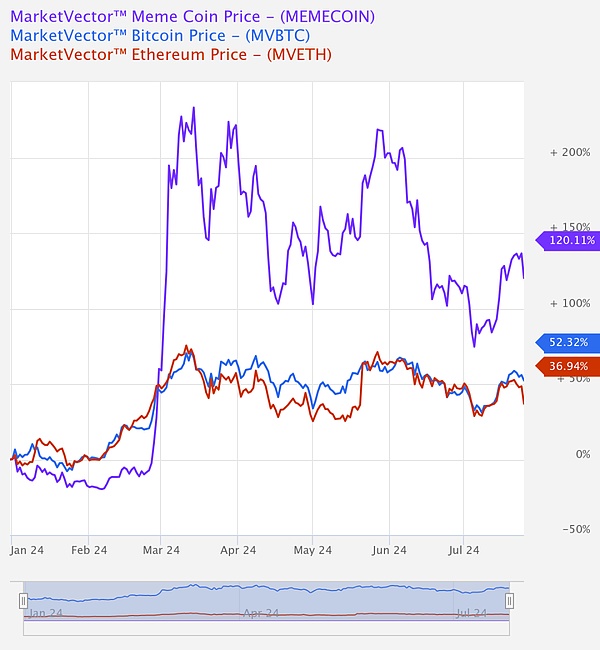
The Meme Coin Index launched by MarketVector tracks the return performance of the 6 largest Meme tokens by market value.
The main components include $DOGE, $SHIB, $PEPE, $FLOKI, $WIF and $BONK, which best represent the overall performance of Meme coins.
By comparison, it can be seen that the performance of Meme coins from the beginning of the year to date is really eye-catching, with a 120% increase, exceeding BTC with a 52% increase and ETH with a 37% increase.
Summary & Risk Warning
Combined with the dumbbell strategy, it can be seen from the above indicators that BTC and ETH are indeed well-deserved safe assets under the current market conditions, with a high market share.
Especially BTC, which is even stronger than ETH. From the comparison of return rates, it can be seen that Meme coin is still the representative of high-risk and high-return assets. On the other hand, most altcoins are still relatively sluggish overall, and there are not many opportunities. It doesn’t matter if you put less chips.
Here we should also remind you of the risks. Crypto asset allocation is a very difficult thing. It is not a simple matter of using a few indicators.
But in any case, please remember that taking risks is meaningful only when most of the funds are very safe. People who have experienced multiple rounds of bull and bear markets must be deeply touched! As the old saying goes, if you keep the green mountains, you will not be afraid of running out of firewood.
 JinseFinance


