Exploring the growth trend and price law of Bitcoin has always been the holy grail of research in this field. There are numerous studies of this kind, from the S2F model to the Metcalfe model, from the supply and demand relationship to the hash rate. Different perspectives lead to different model parameter dimensions, and the different parameter dimensions fundamentally determine the differences in the model's ability to explain Bitcoin laws.
Starting from this article, I will introduce some mainstream Bitcoin price analysis frameworks. As the first article, I would like to introduce the Bitcoin logarithmic growth model in a more intuitive way. There will not be too many formula calculations and codes designed here.
Also, thanks to apsk32 on X for the animation. The following figure is the overall logarithmic growth model animation. I will decompose it and gradually analyze what it wants to express.
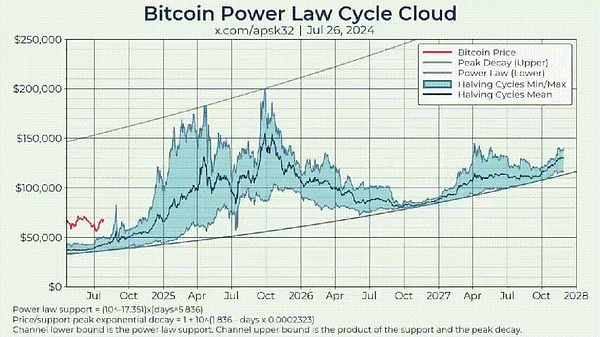
Let's get started.
Logarithmic processing first - change the data format and re-understand the price pattern of Bitcoin
Take the base 10 logarithm of the Bitcoin price. You can see that the Y-axis is labeled in exponential increments of 10 and the density in each scale is inconsistent. This is also the characteristic of the logarithmic function.
2. Data fitting, find the Bitcoin support line
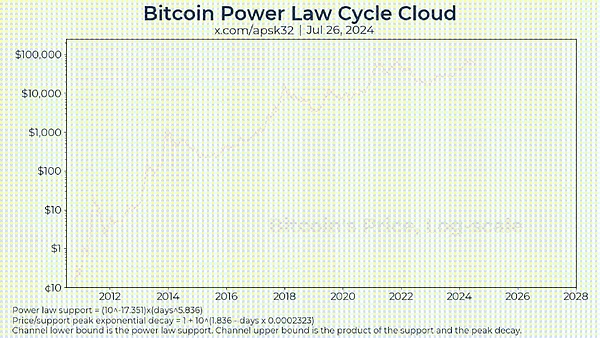
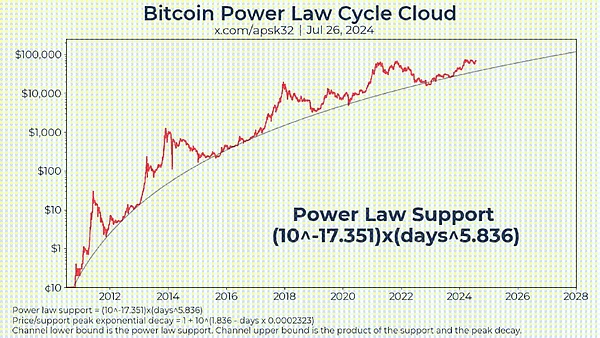
Using the linear regression method to fit the transformed data, you can find the best matching straight line (the straight line formula has been marked in the figure), which is the support line, showing the theoretical lowest point of Bitcoin price under this model.
The meaning of this line in actual operation is very simple: if it is lower than this line, the market is likely to have panic selling, and the best time to buy has appeared.
3. According to the support line, find the price ceiling and determine the cycle law
Use the support line to calculate the ratio of price to support value. It can be clearly seen in the above figure that the price of Bitcoin soared during the bull market relative to the support line, and these peak values are declining in each cycle. Similarly, we can also obtain the price ceiling function. This exponential function will enable us to derive the upper limit of the price.
What this animation wants to express is that as time goes by, the highest value of Bitcoin in the cycle is gradually decreasing, that is, the highest value of each cycle is decreasing. (Of course, here we can actually calculate the law of the maximum value decreasing by calculating the oscillator value. The figure below is a fitting I made with the data from the beginning of this month) 4. Inversely infer the price ceiling according to the upper limit function If you know the equation of the price/support upper limit, then you can calculate the price ceiling by multiplying it by the value of the support line. (Price/support upper limit) × support = price ceiling. So this figure shows that if the price of Bitcoin exceeds the price ceiling in the future, the market is in an overbought state and it is necessary to choose an opportunity to leave.
5. Aggregating the lines in 4 cycles will roughly get the trend of the next cycle
Translate the lines in the first four cycles, move them into the fifth cycle we are currently in, and then average them, we will see what the future price trend may look like.
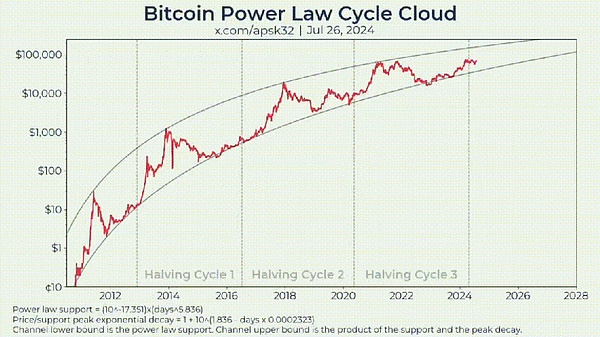
So this netizen apsk32 from the X platform concluded about the future: If the price/support ratio trend continues, this cycle will peak between $160,000 and $190,000 in 2025. Some people may think this is bearish, but this trend also shows that Bitcoin will break through one million US dollars in the 2030s.
This is a simplified logarithmic model analysis. Netizens have labeled this chart as a power law model, which is actually wrong. The power law model is a double logarithmic processing of Bitcoin price and time, and the single logarithmic processing is a logarithmic growth model.
Finally, no matter what, the model is ultimately a simulation of the future based on historical data. But the future is often unpredictable, but we can try to find that rhyme.
For more real-time data, please check: https://www.coinglass.com/pro/i/bitcoin-rainbow-chart
 JinseFinance
 JinseFinance
 JinseFinance
 JinseFinance
 JinseFinance
 Xu Lin
 JinseFinance
 JinseFinance
 Beincrypto
 Bitcoinist
 Cointelegraph