Author: Glassnode, Marcin Miłosierny; Compiler: Deng Tong, Golden Finance
Abstract
Monthly Overview: While the approval of the new spot Bitcoin ETF is a significant moment from a narrative perspective, the massive outflow of funds from GBTC will It became a “sell the news” event. On the other hand, the broader altcoin market, led by Ethereum, has shown resilience, which could indicate a possible shift in capital flows.
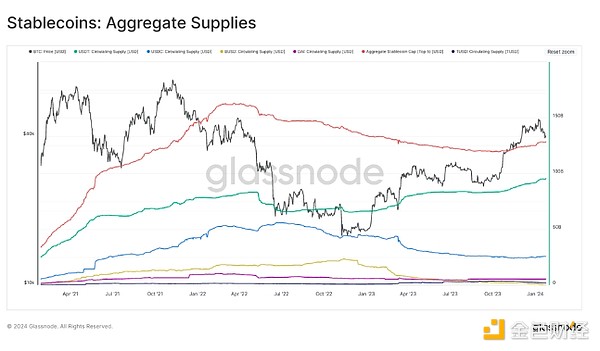
Market Momentum: The expansion of the stablecoin market indicates growing liquidity, which seems ripe to impact trading in the near future. Current cycle analysis shows that the market is in early positioning and the likelihood of trend continuation is high. At the same time, volatility in Bitcoin and Ethereum continues to rise, requiring caution.
Metric Spotlight: Active addresses provide insights into network activity and health, serving as a barometer of potential changes in market sentiment and investor behavior.
Starting this issue, our goal is to provide the essence of market dynamics and fundamental analysis in a more understandable and actionable format. We hope that with this new focus, we can highlight the practical value of Glassnode data and on-chain analytics, especially for momentum and directional traders, enabling fast, informed trading decisions.
Monthly Market Overview
January saw a watershed moment for the cryptocurrency market, with new spot Bitcoin ETFs are approved and traded in the United States in a historic move. This landmark event ushered in a wave of institutional capital, demonstrating Bitcoin’s growing acceptance in mainstream financial markets. Despite this, the market has experienced a “sell-off news” phenomenon, with Bitcoin price volatility increasing, hitting new multi-year highs and lows in a short period of time. This kind of volatility provides unique opportunities for momentum and directional traders.
Ethereum (ETH) and altcoins rallied, with ETH posting its first performance since October 2022 Overtaking Bitcoin, this suggests a possible change in capital flows and interest in assets that are further along the risk curve. There has been an increase in activity in the ETH derivatives market, signaling growing optimism about the approval of an ETH ETF despite regulatory challenges.
The market is still digesting a huge oversupply caused by the conversion of Grayscale Bitcoin Trust (GBTC) into an ETF. This event triggered a massive capital rebalancing and affected market dynamics. Nonetheless, Bitcoin’s price resilience is evident, with realized cap indicators showing strong capital inflows, albeit a slower recovery compared to previous cycles.
The strong on-chain transfer volume and large transaction flow prove the existence of institutions and large capital investors. These developments highlight the growing institutional interest in Bitcoin and indicate an expanding base of market participants.
Market Momentum: Stablecoin inflows indicate investors are preparing to deploy capital
< h3>Stablecoin Market Dynamics
The stablecoin industry has seen a significant increase in fiat currency inflows, with the total supply of U.S. dollar-pegged tokens reaching $128.5 billion. This surge was primarily driven by Tether (USDT), which captured 74.3% of the market, or $95.5 billion in market share.
Cycle: macro perspective
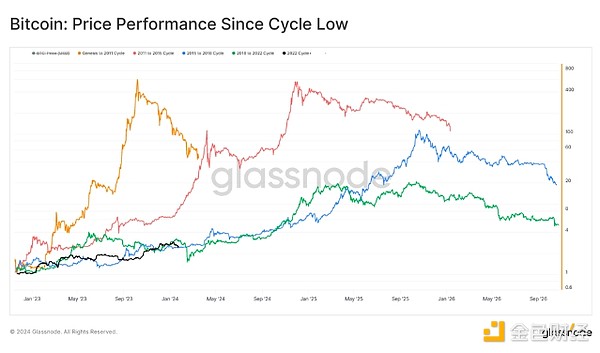
The cryptocurrency market appears to be in the initial stages of the typical three-stage cycle observed historically:
Pre-Bull Market Phase:Currently, the market is The recovery range after experiencing a cycle low lays the foundation for the next index rebound.
Mania Phase: This phase is characterized by a rally above the previous cycle’s all-time high (ATH) in an effort to reach new heights.
Post-ATH Phase: After a new ATH is established, this phase involves a prolonged period of depreciation, marking a cooling off from the peak of market activity.
Volatility of various industries Rising
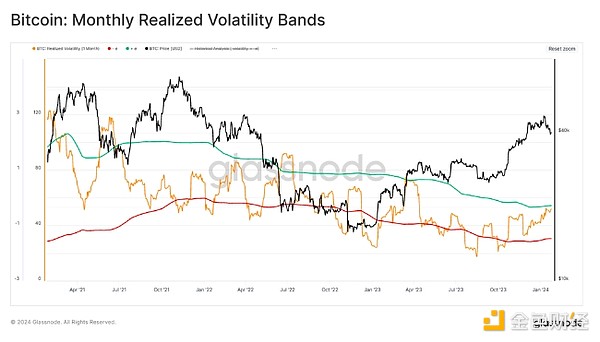
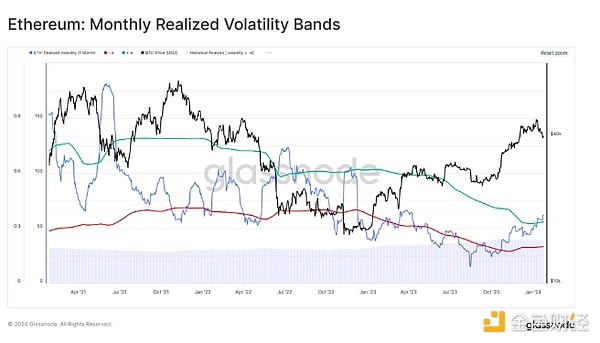
Bitcoin and Ethereum’s monthly volatility spiked, approaching statistically high levels. For momentum and directional traders, increased volatility is a key indicator in the early stages of a bull market, signaling potential entry points for strategic trades before correction risk increases.
Supply profitability and market de-risking
Bit Coin and Ethereum supply as a percentage of profits have reached statistically significant high levels, indicating that a significant portion of the market holds profitable positions. This situation has often occurred at the beginning of previous bull markets, indicating possible de-risking.
Selling pressure is expected to come from new investors who accumulated positions during the recovery from bear market bottoms as they seek to take profits. The slight delay in the expected correction may be due to the market's belief in the rebound potential following the ETF's approval.
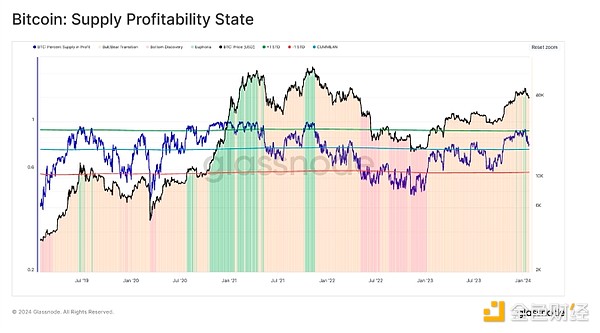
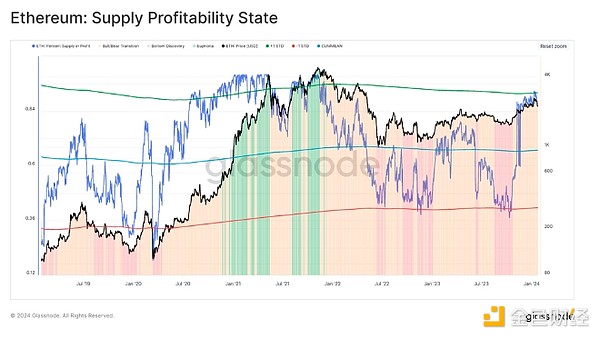
For directional traders, these indicators emphasize the need to be aware of the long position at hand. or be alert to potential entry points for short trades. The increase in stablecoin supply indicates that liquidity is increasing, potentially driving the next market rally. However, escalating volatility and profitability indicators suggest the market is ripe for a correction, underscoring the need for prudent risk management and readiness to take advantage of market moves.
Metric Spotlight: Active addresses as a measure of sentiment and network health
< h3>Metric Spotlight: Active Addresses
This metric measures the momentum of network activity by comparing the monthly average (short-term) of new addresses to the annual average (long-term), providing insight into the health of the network and adoption rates.
Look for trends: A monthly average (red curve) above the annual average (blue curve) indicates expanded on-chain activity, indicating improving network fundamentals. Conversely, a monthly average below the annual average indicates contraction, indicating a decrease in network utilization.
Historical Case: In 2018, despite bearish price trends, prices remained above the monthly average, indicating increasing network strength, setting the stage for a bull run in 2020-2021 contribute. Instead, prices fell below this level at the start of 2021 despite higher prices, indicating reduced activity and potential market challenges.
Tools used: Measure momentum by focusing on the relative position and distance between monthly and annual averages. Monitor breakouts above or below key moving averages (such as the 200-day moving average) for additional context.
Indicator changes:Active address momentum, active entities.
 JinseFinance


