Source | Finance Research Letters
Author | SeungOh Han
Compiler | Chen Yanting
In August 2024, Finance Research Letters published an article titled "Nonlinear relationship between cryptocurrency returns and price sensitivity to market uncertainty", which studied the nonlinear relationship between cryptocurrency returns and price sensitivity to market uncertainty. The author selected data from June 2018 to February 2023, and after controlling for market, size, reversal, and liquidity factors, found that the risk-adjusted weekly returns of cryptocurrencies with medium uncertainty risk were 5.73% higher than those with low and high uncertainty risk, proving the nonlinear relationship between cryptocurrency returns and the beta factor of the volatility index (VIX). Paying too high a price for lottery-like cryptocurrencies reduces expected returns, further explaining this nonlinear relationship. The correlation remains robust when using two cross-sectional regressions, various quantile combinations, and other risk factors. The Institute of Financial Technology at Renmin University of China compiled the core part of the study.
I. Introduction
Systemic risk is associated with common factors that affect investors' expected returns on assets. In equilibrium, asset prices should reflect the premium that investors demand to hold assets that are more sensitive to systemic shocks. Previous asset pricing research has focused on traditional financial assets, but a growing body of literature has proposed several possible factors that can provide a cross-sectional explanation for the expected returns of cryptocurrencies. For example, Liu et al. (2020) identified the three most widely known factors in the cryptocurrency market (i.e., market, size, momentum). In addition, Liu and Tsyvinski (2021) demonstrated that the returns of cryptocurrencies are predicted by the common changes in network users. Other papers have proposed factors such as liquidity risk, contagion risk, and idiosyncratic volatility.
Another body of asset pricing literature considers market uncertainty risk as a possible influencing factor. There is ample evidence that sensitivity to market uncertainty is an important factor affecting financial markets such as stocks, bonds, and foreign exchange. Other related studies have examined how the volatility of individual cryptocurrencies explains returns. For example, Zhang and Li (2020) found that idiosyncratic volatility is positively correlated with expected returns of cryptocurrencies. Previous studies have also explored the relationship between cryptocurrency returns and market uncertainty. For example, Akyildirim et al. (2020) showed that there is a time-varying positive correlation between the conditional correlation of cryptocurrencies and financial market stress measured by the Chicago Board Options Exchange Volatility Index (VIX). Meanwhile, Smales (2022) demonstrated that the level of the volatility index is negatively correlated with returns. Existing studies have mainly focused on the returns of cryptocurrencies and the volatility level of individual cryptocurrencies or stock market volatility. However, to the best of the authors' knowledge, no studies have pointed out the relationship between cryptocurrency returns and their price sensitivity to financial market uncertainty, that is, whether the price of individual cryptocurrencies depends on their sensitivity to abnormal changes in the VIX. Based on the original asset pricing research, this paper further studies the role of uncertainty risk in the cryptocurrency market and contributes to the existing cryptocurrency research. In addition, this paper explains for the first time that cryptocurrencies with high sensitivity exhibit nonlinear characteristics of lower required return process through their lottery-like characteristics, thus enhancing our understanding of the cryptocurrency market.
2. Research Process
2.1 Data
2.1.1 Weekly Risk Factors
The authors collected daily cryptocurrency data from coinmarketcap.com from September 16, 2017 to February 17, 2023, for a total of 1981 days. To avoid potential problems with inactive and small cryptocurrencies, the authors excluded cryptocurrencies with a market capitalization of less than $100,000 in the previous week and fewer than five trading days per week. Since the uncertainty risk factor (ΔVIXt) and the liquidity risk factor (LIQt) are non-traded factors, they represent sources of uncertainty associated with non-traded macroeconomic or overall market variables, the authors derive unexpected changes in stock market volatility and broad liquidity in the cryptocurrency market through regression residuals. Other tradable risk factors such as market (MKTt), size (SMBt), and reversal (DMUt) are constructed based on cryptocurrency portfolios.
2.1.2 Weekly beta factor
The main research question of this paper is: Is the beta factor of VIX priced in the cross-section of cryptocurrency returns? The beta estimate indicates the sensitivity of individual cryptocurrency returns to a specific risk factor. For each cryptocurrency, a time series regression model is used to estimate its sensitivity to the selected risk factor. The formula is as follows: 2.2 Empirical Analysis 2.2.1. Summary Statistics Table 1 presents the descriptive statistics of the overall risk factors and individual beta estimates. Panel A reports the descriptive statistics and correlations of the risk factors used as explanatory variables in the regression model, using data from September 22, 2017 to February 17, 2023. The volatility factor has a moderate simultaneous correlation with other factors, highlighting the potential of the uncertainty risk factor as a candidate factor. VIX innovation is negatively correlated with the market factor, indicating that the overall market uncertainty or market panic index tends to decline when the market is bullish. In addition, VIX innovation is also negatively correlated with the liquidity factor, indicating that market liquidity increases when market panic eases. Panel B reports the median cross-sectional statistics of the weekly betas estimated from equation (1). The weekly betas in Panel B span 245 weeks, from June 15, 2018 to February 17, 2023, with an average of 661 cryptocurrencies per week. Both the VIX beta and liquidity beta are negative, while the other betas are positive. The coefficient of variation (CV) indicates that the dispersion of VIX betas is sufficient to explore the cross-sectional variation of cryptocurrency returns.
Table 1 Descriptive statistics of overall risk factors and individual beta estimates
Panel A Descriptive statistics of risk factors

Panel B Medians of cross-sectional statistics of individual betas

2.2.2. Portfolio Analysis
This paper uses the portfolio approach described by Daniel and Titman (1997) to explore the relationship between market uncertainty betas and cryptocurrency returns. Specifically, cryptocurrencies are sorted into ten portfolios each week based on their pre-ranked VIX betas, which are estimated using the time series model developed in this paper. Table 2 shows the average cryptocurrency characteristics, excess returns, and risk-adjusted returns (alphas) for each decile of portfolios sorted by VIX beta, as well as the long-short portfolio. Pre-ranked VIX betas and prices are value-weighted averages of the week each decile portfolio is formed, and excess returns are value-weighted averages of the excess returns of the decile portfolios in the following week. Alphas and test statistics are estimated using the Gibbons et al. (1989) test, which is a time series regression of each portfolio's excess returns in the following week on different factor models. The sample period covers 245 weeks from June 15, 2018 to February 17, 2023.
Table 2 Portfolio Analysis

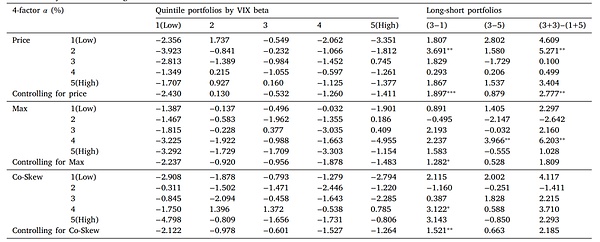
Table 3 reports the four-factor risk-adjusted returns (alphas) of volatility index beta-sorted portfolios formed within quintiles of various cryptocurrencies with lottery-like characteristics (e.g., price, maximum, conditional skewness). The authors first sort cryptocurrencies into quintiles using control variables, and then within each quintile, sort cryptocurrencies into quintile portfolios based on pre-ranked VIX beta. The five VIX beta-sorted portfolios are then averaged over the control quintiles to construct quintile portfolios with dispersed VIX but similar levels of control variables. Time series regressions of the next week's excess returns for each portfolio are tested on the four-factor model (MKT, SMB, DMU, LIQ). Column (3−1) represents the difference in alpha between portfolio 3 and portfolio 1. The sample period is 245 weeks, from June 15, 2018 to February 17, 2023.
Table 3 Portfolio Analysis: Dual Classification

2.2.3. Cross-sectional Analysis
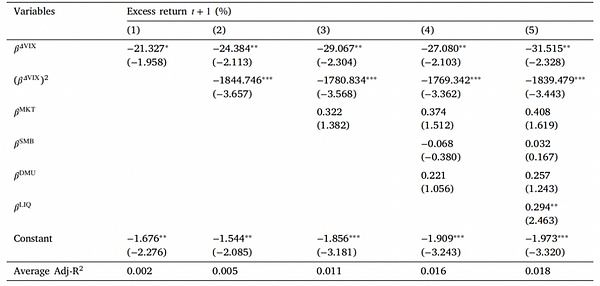
Table 4 reports the risk premium and t-values, and the robust standard errors are calculated using the method of Newey and West (1987). Overall, the results of Table 4 are consistent with those of Table 2, confirming the nonlinear and concave relationship using two-pass cross-sectional regression tests on individual cryptocurrencies.
Table 4 Cross-sectional asset pricing tests for individual cryptocurrencies

III. Conclusion
This paper studies the relationship between US stock market volatility and cryptocurrency returns from 2018 to 2023. The empirical results show that a portfolio that buys cryptocurrencies with medium uncertainty risk and sells cryptocurrencies with low or high uncertainty risk can achieve significant risk-adjusted returns, revealing a nonlinear relationship between uncertainty risk and returns. Overvalued lottery-like cryptocurrencies reduce expected returns, explaining this nonlinear relationship. The regression results remain robust across different model specifications.
Future research can explore the relationship between uncertainty risk and individual cryptocurrency returns by using the volatility of the digital asset itself or the attention index from social media or search engines instead of the volatility of the US stock market.


 JinseFinance
 JinseFinance
 JinseFinance
 Joy
Joy Joy
Joy Zoey
Zoey Catherine
 Beincrypto
 Beincrypto
 Beincrypto
 Bitcoinist